Daily Day trading Chart for SOXL (Jan 17th 2024)
Everything is pointing to bullish for the day, however I have outlined a scenario where a short would be possible on SOXS. I also include a short explanation of how I use the 111 SMMA and why.
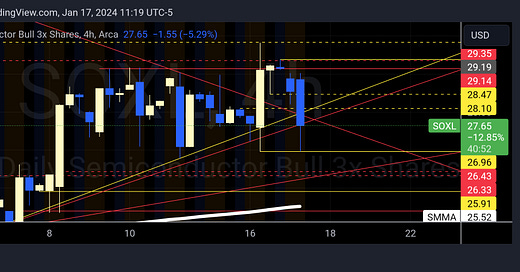
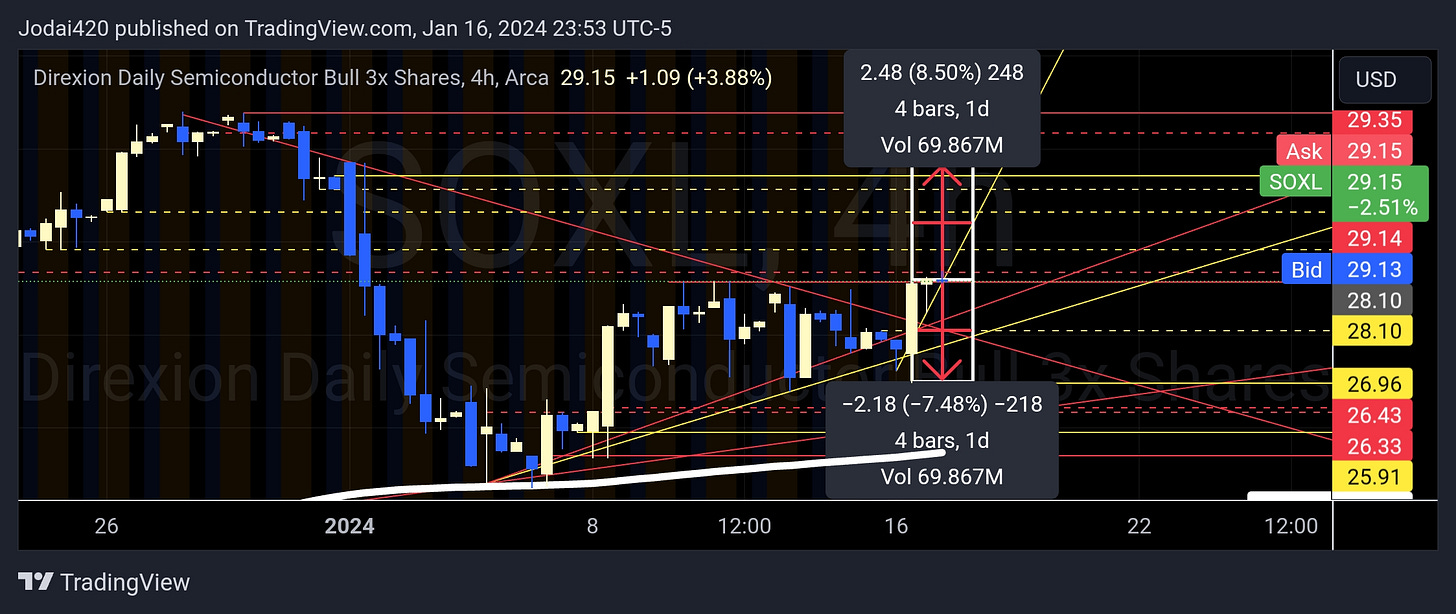
Trade Update - Due to the price rejecting off the 4hr hold level yesterday, price was actually looking for the opposite 4hr hold or break level and since the 4hr hold level failed to hold the price, we first touched the 4hr break level. Which gave a strong reaction, turning the break level into an origin level(super important levels, that hold through time) sending price back up and hopefully above the 4hr trendline.
If price fails to reach back above that 4hr Trend, I fully expect my bearish scenario to play out. Which would be a test of the daily hold or daily break level on the bottom side.
The price for the day closed above the daily break level, and held on top of it before the bell closed as seen in the daily chart.
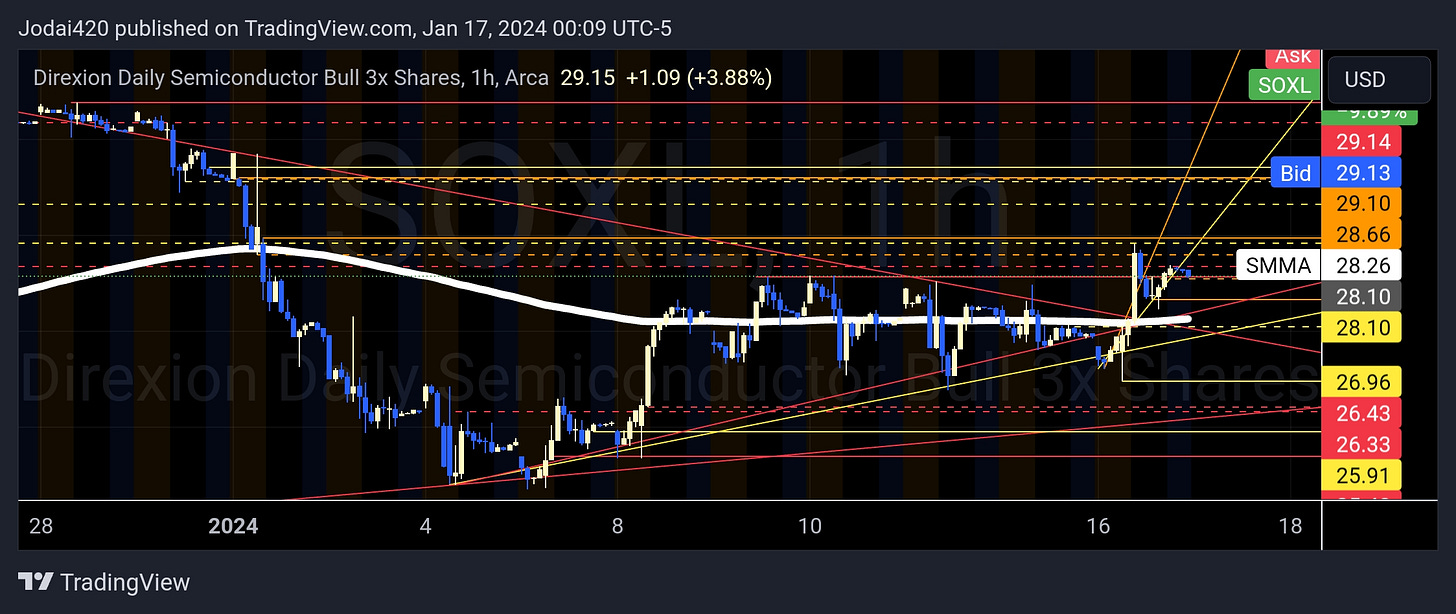
I'm guessing tomorrow will be another accumulation candle because there really isn't a ton of resistance in the way, in terms of the 4hr or 1hr charts. I really don’t expect to run into any resistance until at least the $31.00-$31.15 range. The 1hr chart below shows this.
However, if the price starts to drop below the daily break level or the daily global trend while also ignoring the 1hour hold level at $29.14, which is also the daily break level, price is going to come back down to the daily legacy trend and the daily hold level at $26.43.
Both ideas are represented on the chart above. As the trading day gets under way tomorrow, we will know which direction we are headed within the first 30minutes of the market being open.
Each move is about equal in terms of possible profit.
Not financial advice! Trade at your own risk!
Support & Resistance Levels
Red Solid Lines = Daily Break Levels
Red Dashed Lines = Daily Hold Levels
Yellow Solid Lines = 4hr Break Levels
Yellow Dashed Lines = 4hr Hold Levels
Orange Solid Lines = 1hr Break Levels
Orange Dashed Lines = 1hr Hold Levels
Trend Lines
Red = Daily Trend
Yellow = 4hr Trend
Orange = 1hr Trend
Smoothed Moving Average
The white bold squiggly line is the 111 smoothed moving average, which acts as both support and resistance depending on which side of the line the price is on. When price crosses over and then back tests the 111 SMMA and holds on the other side, is a good indication that price has stopped going in the direction it was and is headed back the otherway.
Like line work, the 111 SMMA can also be used fractally on each time frame to help one get a better idea as to which direction the price is headed.
We are clearly bullish on the daily and the 4hr. We lost the 1hr after the November/December Christmas rally, which resulted in the pullback. Well it hit a monthly hold level, but the 111 SMMA on the 1hr chart confirmed that price indeed had reached its peak.
You can see that the 111 SMMA has been acting as resistance on the 1hr chart. However as the price keeps pushing against the 111 SMMA, it finally is able break out, making the 1hr chart bullish again.
The 111 SMMA is a very unique SMMA, in that it is the one that I found most BOT traders were using for determining the direction of price. Since the majority of the markets price action is derived from bots, it makes sense to trade like the bots, or at least know how they trade so that you can use that information to your advantage.


