
WTI’s $58-$65 Box for Crude Oil Is Not 'Stability,' It’s Deferred Volatility
WTI crude is trading around the high-$50s, and the market looks like it has found a “floor.” That is the comforting headline. The more useful truth is that this looks like a price-discovery bottleneck


Technical Analysis contained in this post was performed manually by Andrew Jodice of Markets, Liberty, & Discipline. He’s studied and blends Al Brooks’ theory, Richard D. Wyckoff’s theory, and Charles H. Dow’s theory to conduct his analysis, and implements Al Brooks’ strategy to execute trades.

WTI crude is in a trading range where physical fundamentals, macro credit conditions, and policy-driven distortions are temporarily canceling each other out.
When governments and central banks talk about “stabilizing” growth or “managing” inflation, they are implicitly claiming that they can manage the most important variable in any commodity, the price signal. However, energy is a scarcity market, and scarcity markets do not obey press conferences. If the price is being held in a tight trading range, the question for investors is not “Is oil stable?” but rather where is the risk being warehoused, and what will force that supply back onto the tape?
Smart investors start with what the charts are saying in plain English.
The One-Year Picture Is A Box With Sharp Edges
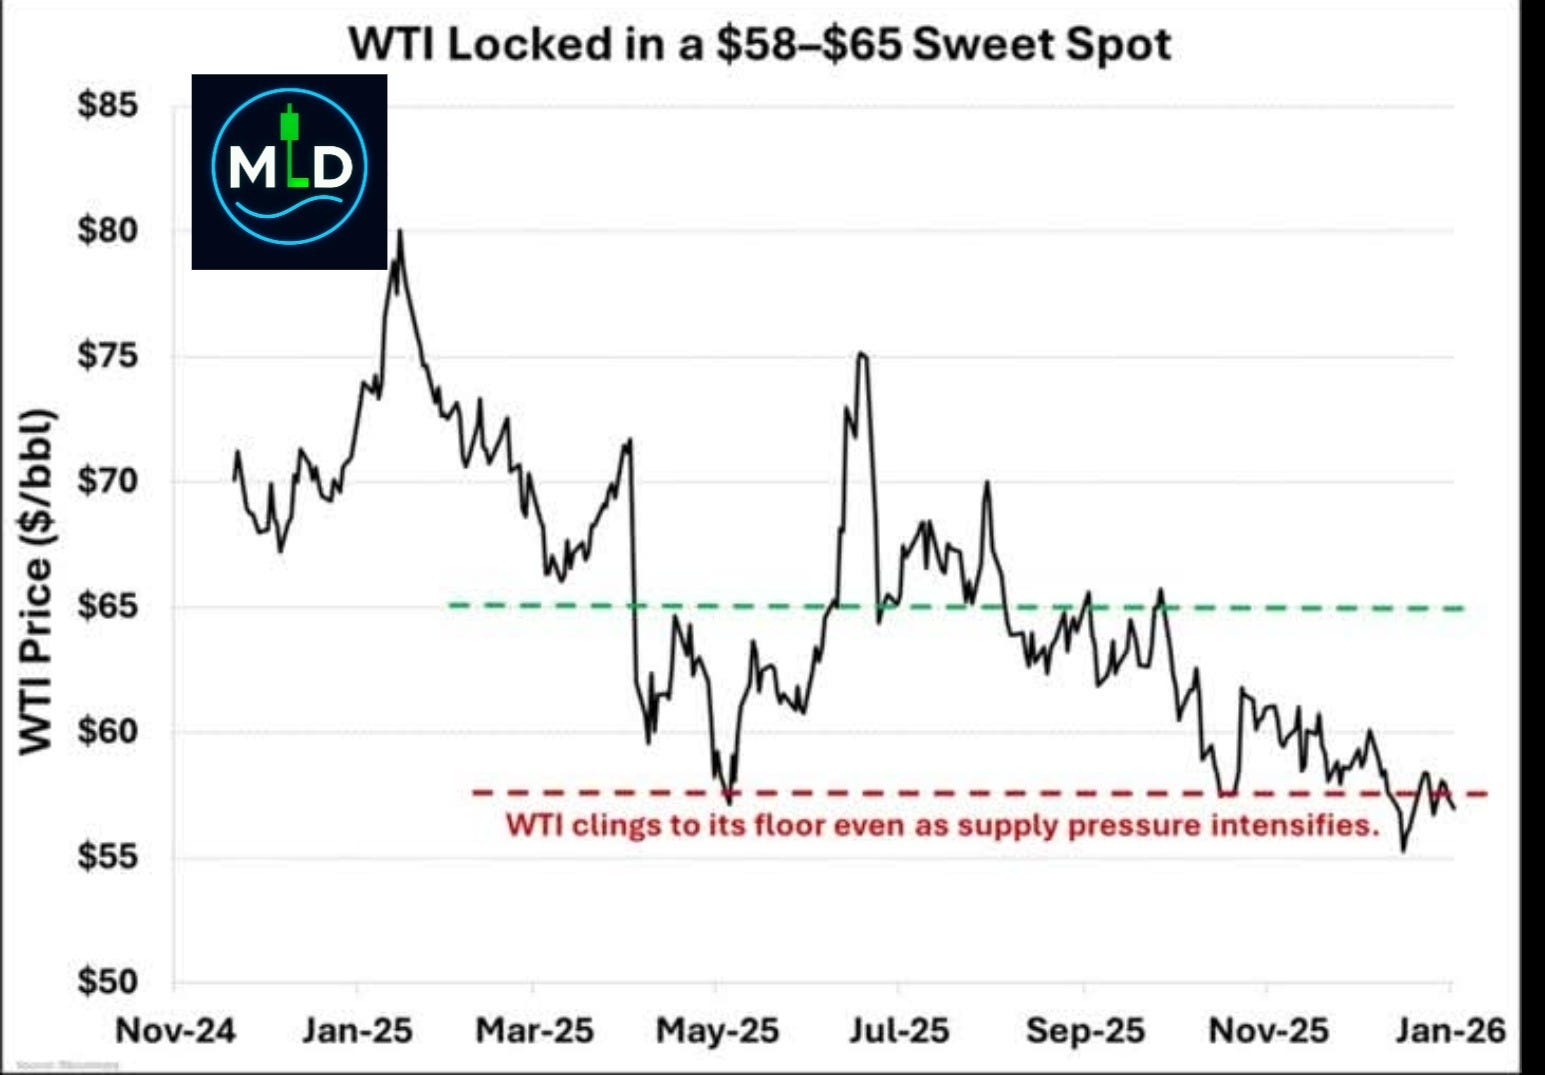
The range for crude oil practically jumps off the chart it is so obvious. Price has repeatedly failed near the mid $60s and price has repeatedly found buyers in the high $50s absorbing any sell offs. Crude oil is not in a bullish uptrend. Crude oil is in a market that is being rationed by the constraints in inventory capacity, marginal production economics, and a macro regime that is tightening the leash on the demand for oil.
On the daily chart above, the micro-structure is even cleaner. Price is making lower highs inside a downward channel. Repeated tests of the same demand shelf show that a lot of absorption is taking place around the $58–$60 area. This is classic market compression and market compression is tradeable information. Market compression tells investors that positioning and hedging flows have been organized around a narrow range of levels.
For investors who are trading this range, the practical takeaway is simple. Investors do not think of the $58 to $65 range as a forecast, but rather a defined battlefield between different institutions and different suppliers all fighting for control of the price of crude oil. The only part of a channel that matters are the edges because the edges are where risk managers are forced into making a decision.
The Yield Curve Grows Steeper, But Not For Good Reasons
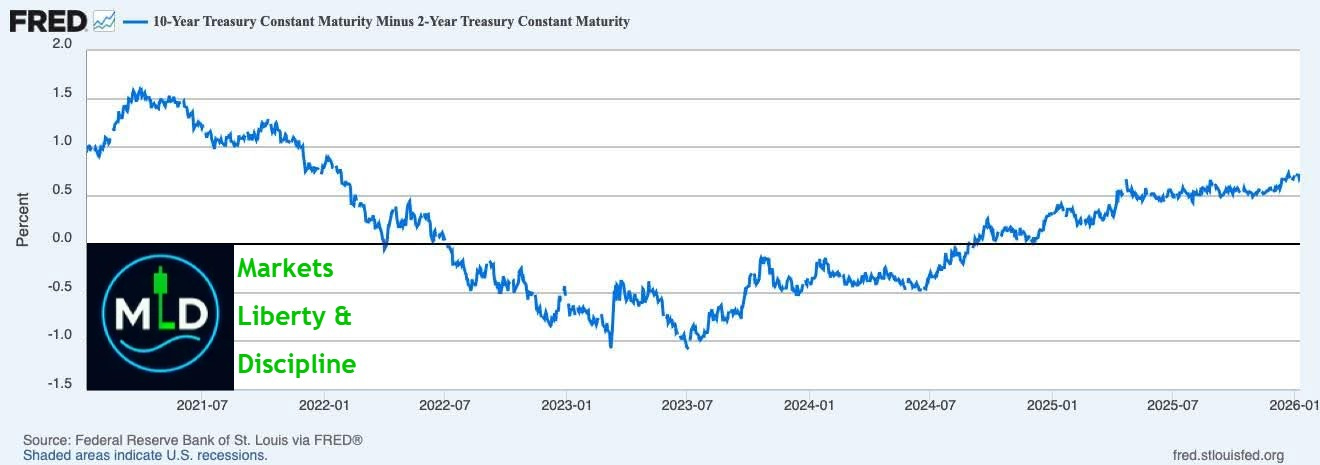
Take a look at the credit signal in the chart above. The 10-year minus 2 year Treasury spread has once again turned positive. FRED shows that the 10 year Treasury yield at 4.19% on January 8th, 2026 and the 2 year at 3.49% the very same day. The math is straightforward.
4.19% − 3.49% = 0.70% = 70 basis point spread. (FRED)
FRED’s spread series prints 0.64% on January 9th, 2026. (FRED)
Austrian economists treat the yield curve as a “lie detector” for the credit cycle. Austrian economists aren’t mystical seers, they just treat yield curves as aggregates of millions of decentralized decisions about time preference, inflation risk, and future policy. The Cleveland Federal Reserve’s long running work on the yield curve emphasizes a blunt historical pattern. An inversion has preceded each of the last eight recessions(NBER-defined), and the yield curve’s slope contains forward looking information regarding growth. (Cleveland Federal Reserve)
What matters for oil is the mechanism. A curve that is steepening because markets expect short rates to fall is not the same thing as a curve steepening because growth is accelerating. Rate-cut expectations can coincide with deteriorating demand conditions. Charles Schwab’s 2026 fixed income outlook explicitly frames 2026 as a year where rate cuts are expected in response to a weakening labor market, while warning that longer term yields may not fall as far because inflation pressures combined with heavy bond supply are able to keep the long end elevated. (Schwab Brokerage)
That matters because oil is not just an inflation hedge. It is a growth input vehicle as well. If the bond market is pricing the federal reserves policy of quantitative easing due to slowing conditions. It is not the macro regime where demand driven crude oil rallies are able to sustain themselves.
Fundamentals: Official Forecasts Lean Oversupply, Not Scarcity
This is where the “range” starts to look less like equilibrium and more like a holding pen.
The EIA’s Short-Term Energy Outlook states plainly that global oil inventories are expected to continue rising through 2026, which would put downward pressure on prices. The EIA also forecasts Brent averaging about $55 per barrel in the first quarter of 2026 and remaining near that level for the rest of 2026. (U.S. Energy Information Administration)
If inventories are building, the market is telling investors that supply is outrunning consumption at the margin. In a free market, that would be enough. Price will continue to fall until marginal supply shuts in or marginal demand reappears.
But energy is not a free market. It is a heavily administered market with strategic stockpiles, sanctions regimes, regulatory constraints, OPEC+ signaling, and political narratives about “fair prices.” Those interventions don’t eliminate scarcity or surplus; they redistribute it across time and across jurisdictions. They can postpone clearing, but they cannot repeal it.
The World Bank’s October 2025 Commodity Markets Outlook press release projects broad commodity price declines and explicitly flags an expanding oil surplus, with Brent falling from an average around $68/bbl in 2025 to $60/bbl in 2026. (World Bank)
The IMF’s October 2025 World Economic Outlook projects global growth slowing from 3.3% in 2024 to 3.2% in 2025 and 3.1% in 2026, with risks tilted to the downside. (IMF)
Put those together and you get a coherent base case: modest growth, rising inventories, and a price band that persists until the physical market forces a decision.
So why hasn’t the floor broken?
Because floors in commodities are usually defended by real economics, not optimism.
At some point, a crude price becomes low enough that someone changes behavior: producers hedge less, capex gets cut, marginal wells get deferred, maintenance gets postponed, inventories get drawn down, or demand responds. That response does not need to be coordinated—decentralized adjustment is the whole point of price discovery. But intervention can delay the feedback loop, which is why crude can “cling” to a level for longer than it should, then move violently when the delay finally ends.
That is the Ron Paul critique in market terms: centralized attempts to smooth outcomes don’t remove volatility; they re-time it. The volatility comes back when the intervention runs out of balance sheet, runs out of political cover, or runs into physical constraints.
How Investors Should Map The Tradeable Risk From The Charts In This Article
Range regime is the base case, where $58–$65 holds. If price remains boxed, the market is effectively advertising a mean reversion trade. The risk in taking a trade is not about “missing the rally.” The risk is about getting chopped up by overconfidence in a single direction. Under that regime, discipline beats conviction. Trade a smaller size, define invalidation as it happens, and take profit at the edges of the box, rather than trying to piece together a narrative for a breakout that hasn’t happened.
A breakout regime is the tail risk. Meaning if the box fails,
A sustained breakdown through the high $50s would be the equivalent to the market admitting that the inventory build up is real and the bid was structural rather than enthusiastic. Conversely, a sustained reclaim of the mid $60s would imply either an unexpected demand impulse, a supply shock, or a material shift in policy expectations.
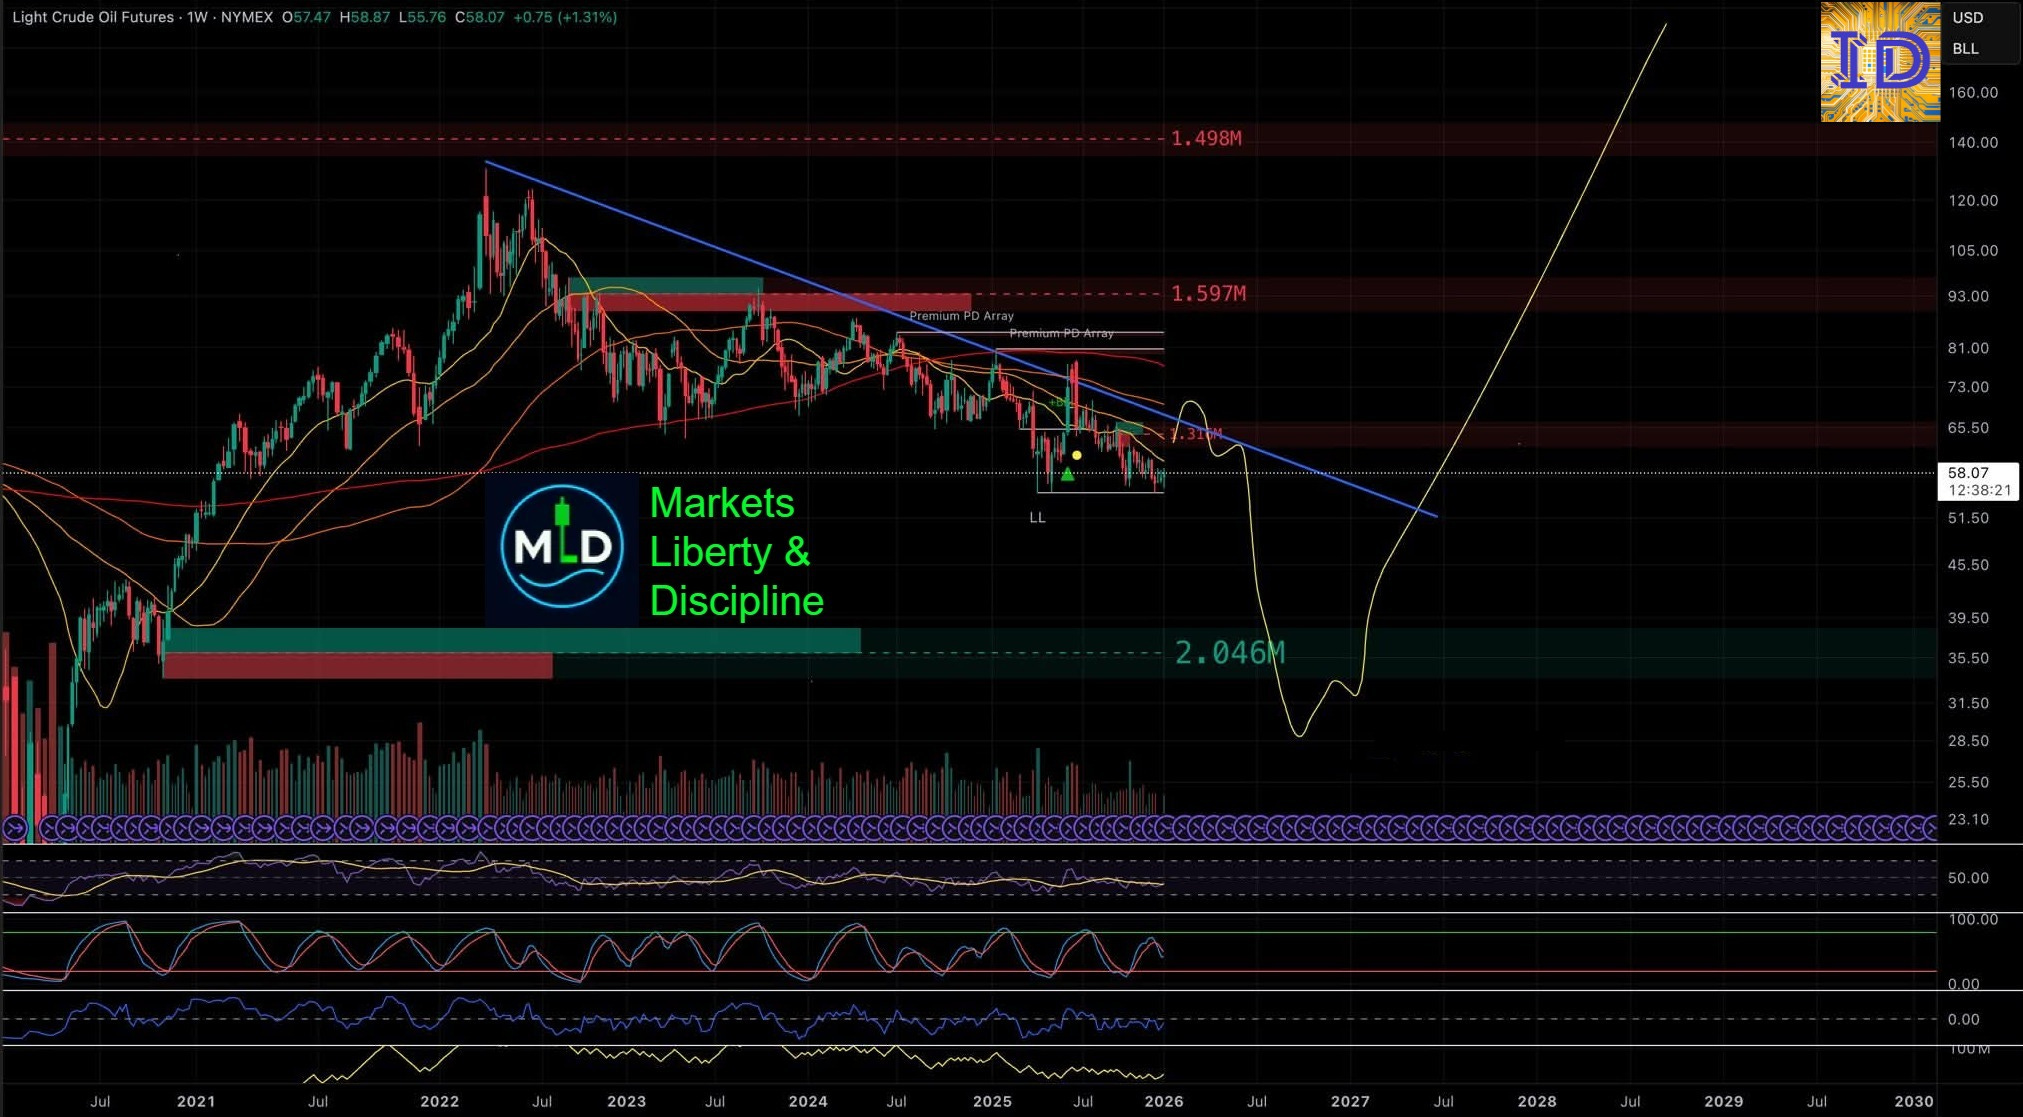
The chart above is essentially about tails. The chart is showing the possibility of an air pocket forming lower, before a much larger cycle can begin, is something investors should keep in the back of their minds. Investors should treat the air pocket possibility for what it is. It is not a prediction, but rather an admission that long duration energy markets move erratically when capital cycles and policy errors collide.
Austrian economics is not about whether “oil goes up” or “oil goes down.” It’s that the more distorted the trade signals become, the more discontinuous the clearing of the range will be. Meaning, The eventual adjustment still has to happen because physical constraints and balance sheets do not negotiate. The system has been prevented from adjusting smoothly & naturally. Due to the boxed behavior, commodities often clears the range in jumps. Whether it be a sudden breakout from the tight trading range, or a sharp repricing, an air-pocket move, or a gap driven by forced hedging or unwinding flows, margin constraints, or abrupt changes in inventories and policy expectations.
Smart Investors Trade Probabilities, Not Narratives
If investors trade crude oil directly, especially through NYMEX WTI crude oil futures (CL), they are trading a leveraged instrument that can & will punish investors who have sloppy sizing & sloppy stop loss placement. (CME Group)
If investors are tempted to treat a tight range as “easy money,” one should recall Al Brook’s stating to only take trades when the traders equation is in their favor. Tight trading ranges created by algorithmic trading, happen so fast that most humans cannot compete against algorithms analyzing the chart from a 1,000 different angles in 3seconds.
We must also remember that the empirical record on short-horizon investing or trading studies of day traders has repeatedly found that the majority of participants lose money after trading fees and taxes. The small minority of people who are consistently profitable, trade with a longer hold time than intraday. (Haas School of Business) The SEC’s own investor guidance on day trading also emphasizes severe losses and the fact that many who try, will never reach profitability.(SEC)
Trading is the only high end profession where someone will buy a book on a Friday, read it on the weekend and then honestly believe that they can trade successfully. Imagine how crazy it would sound to people if I told them I read a book over the weekend on how to perform brain surgery, and that I was operating on a patient with only the book under my belt for brain surgery knowledge! It is absolutely absurd, but for some reason it happens all the time in the financial industry.
I am not stating that most day traders fail because I want to demoralize those who are currently battling through the flames of intra-day hell. Think of it as a reminder that when a market environment is as heavily manipulated as Crude Oil, the best ethical approach for investors on their quest for profitability, is one where humility, clearly defined trading rules and risk management are the only armor that has the capacity to protect an investors capital long enough for them to reach profitability.
The Bottom Line
The highest probability path for crude oil is still sideways to down over the next 6–9 months. The combination of a macro regime that is consistent with slowing growth expectations and official forecasts pointing to rising crude oil inventories, is not a fertile ground for sustained demand led rallies. (U.S. Energy Information Administration)
The higher upside or longer term bullish case is not dead in the water. The bullish scenario requires the market must first clear the current surplus of crude oil and then a re-tightening of the capital cycle must take place. That process tends to be nonlinear. If crude oil policy attempts to “manage” the clearing of the range, the outcome is usually the same. The only difference is a change in the timeframe for when the breakout happens, and when the breakout finally arrives, it will be much more violent.
Educational Disclaimer
This article is for educational and informational purposes only and does not constitute investment advice. Trading and investing—especially in futures and other leveraged instruments—entails substantial risk, including the risk of total loss. A standard futures risk disclosure, notes investors may sustain a total loss of funds deposited to establish or maintain a futures position, and investors may lose more than their initial deposit. (fiadocumentation.org) Most short term or intraday traders lose money over time, and day trading can involve severe financial losses. (SEC) Investors need to consider their own financial situation and risk tolerance. Investors should consult a qualified, licensed, financial professional before making any investment decisions.
Glossary and Further Reading
WTI crude oil futures (CL) — CME contract specs
Brent crude — EIA crude oil benchmarks explainer
Short-Term Energy Outlook (STEO) — EIA STEO report
Yield curve (2s/10s) — Cleveland Fed yield curve and predicted GDP growth
10-year minus 2-year spread — FRED T10Y2Y series
10-year Treasury yield — FRED DGS10 series
2-year Treasury yield — FRED DGS2 series
Bull steepening — Schwab fixed income outlook
Oil inventories — EIA STEO oil section
Floating storage — EIA glossary: petroleum storage concepts
Contango — CME education: contango/backwardation
Backwardation — CME education: contango/backwardation
OPEC+ — EIA: OPEC background
Malinvestment — Econlib: Austrian business cycle theory
Time preference — Econlib: time preference
Commodity Markets Outlook — World Bank press release
World Economic Outlook (WEO) — IMF WEO Oct 2025