
Sound Money Warning: U.S. Equities Outrun the M2 Money Supply
Market capitalization vs M2 (MSCI USA) is stretched versus USA's global peers and how this liquidity gap reframes U.S. stock market risk.

Technical Analysis & Fundamental Analysis contained in this post was performed manually by Andrew Jodice of Markets, Liberty, & Discipline. He’s studied and blends Al Brooks’ theory, Richard D. Wyckoff’s theory, and Charles H. Dow’s theory to conduct his analysis, and implements Al Brooks’ strategy to execute trades.

Most people look at index levels, some look at earnings, but almost nobody looks at what I’d argue is one of the most revealing pictures in global markets right now.
Equity market capitalization divided by the domestic money supply. That’s exactly what the chart below shows.
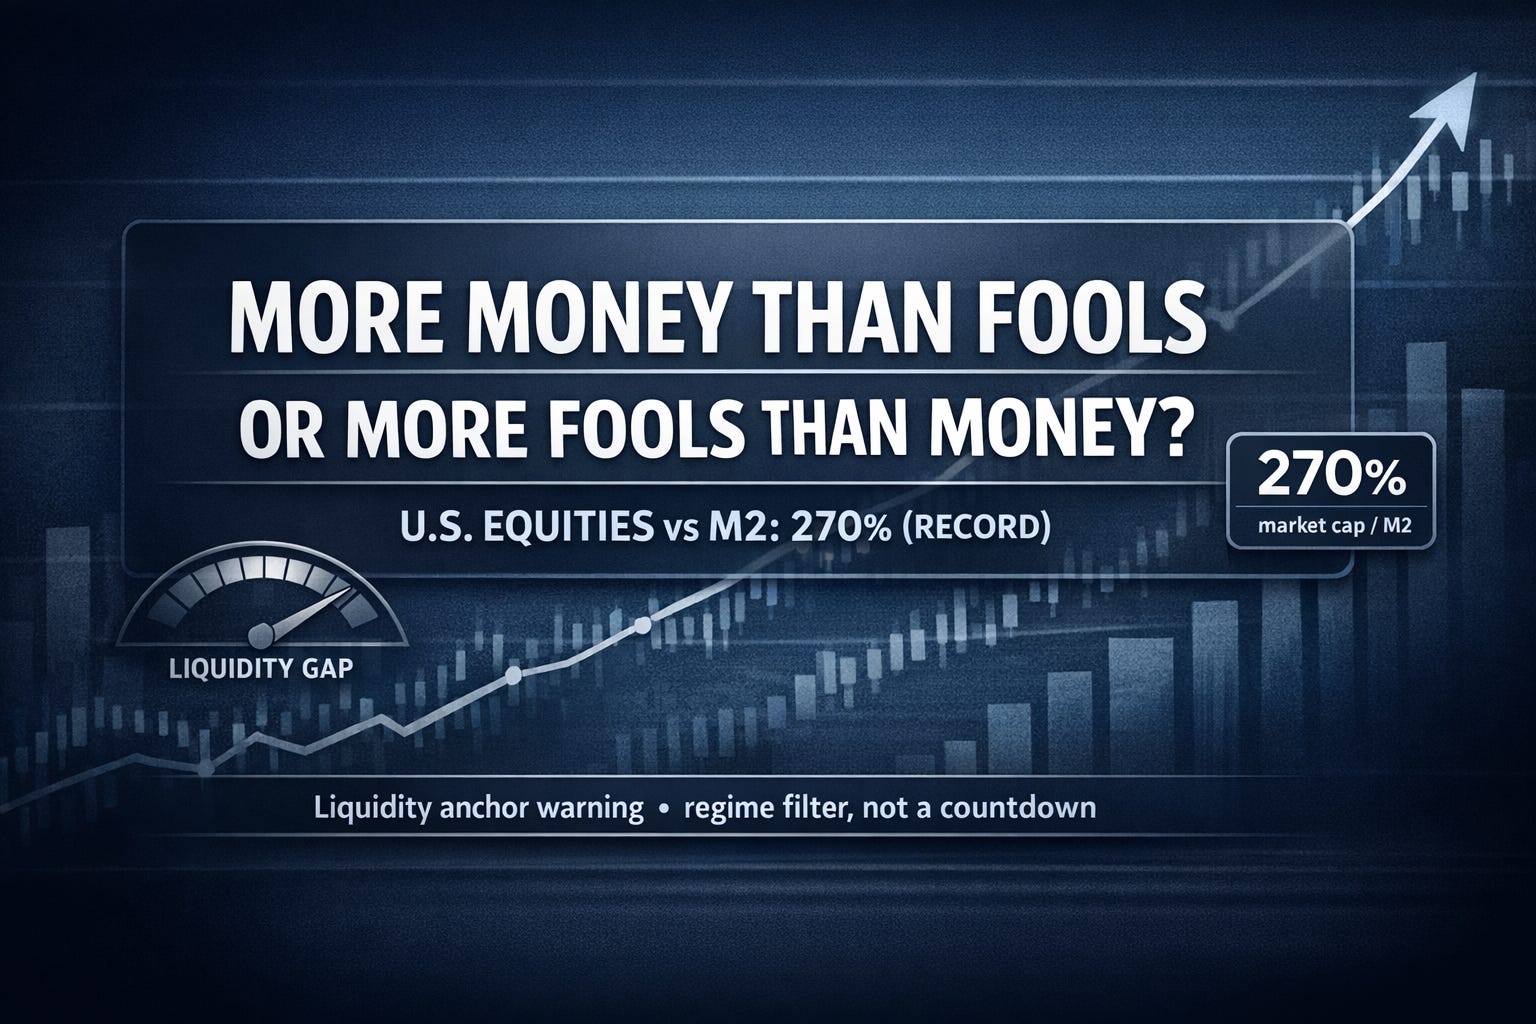
More money than fools or more fools than money?
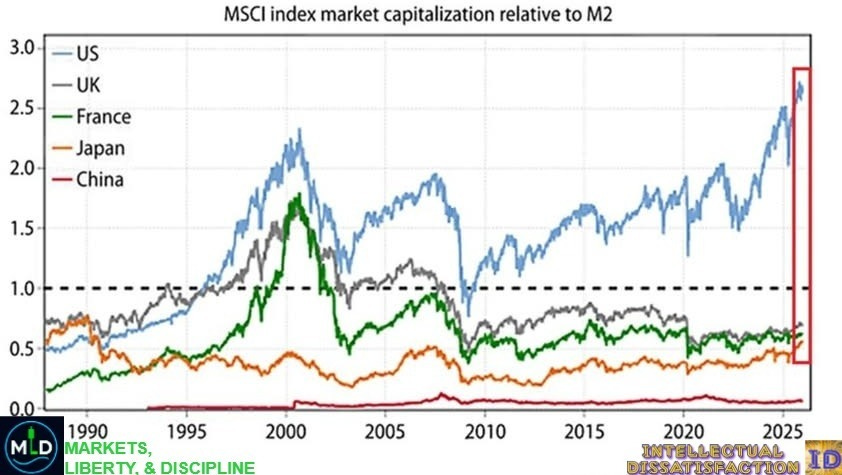
On the y-axis the ratio of MSCI equity index market cap to each country’s M2 money supply, and on the x-axis is time, dating from 1990 through 2025. The lines track the United States, United Kingdom, France, Japan, and China.
There’s a dashed line at 1.0, which is the point where the total equity market is roughly equal to the domestic M2 money supply.
For most of the past three decades, the U.S. line (blue) has wandered above and below that 1.0 line, spiking into the Dot-Com era, collapsing during the global financial crisis, then grinding higher through QE and ZIRP. The recent segment, highlighted by the red box, is different.
The U.S. ratio blows out toward 2.7 to 2.8,which is far above prior peaks.
The U.K., France, Japan, and China all sit clustered below 1.0, mostly between 0.3 and 0.8.
In other words, the U.S. equity market has never been this expensive relative to its own M2 money supply, while other major markets still trade at valuations that look tame using the same metric.
From my seat as a quantitatively-minded libertarian, that picture is not a doomsday signal. It’s a structural regime warning.
Let’s be precise about the mechanics.
For the U.S., the numerator is the total market capitalization of the MSCI USA Index, which is a broad, float adjusted benchmark of large and mid cap U.S. equities. The denominator is the M2 money supply, or the currency in circulation, plus checking deposits, savings deposits, and certain money market balances by construction.
The ratio rises when U.S. equity market cap grows faster than M2.
The ratio also rises when M2 is flat or contracting while stocks rally.
The ratio falls when money growth outpaces equity gains, or when equities correct faster than the money stock.
Around the start of 2026, the MSCI USA Index reported market cap in the low $60 trillion range, while the U.S. M2 was roughly $22 trillion. That implies a market cap to M2 ratio close to 2.7 or about 270%.
The chart confirms that visually. The U.S. line is now visibly above prior spikes in 2000 and 2007. Meanwhile;
The U.K. and France sit near or just below 1.0.
Japan ranges lower, reflecting decades of balance sheet repair and slower nominal growth.
China’s ratio remains a fraction of the U.S. level.
Is this a perfect definition of “liquidity”? No. Global capital flows, private credit creation, and central-bank balance sheets all matter and they are not all fully captured in M2 money supply figures.
If you care about how large the stack of equity claims has become relative to the domestic money supply that prices them. A U.S. reading near 270% while peers cluster below 100% is not a trivial curiosity. It is a sign that U.S. equities are unusually over extended, relative to this particular liquidity anchor.

Through an Austrian leaning, sound money lens, the chart raises a simple but uncomfortable question.
Are we pricing the value of productive enterprise, or are we pricing the long tail of a policy regime(F.I.A.T Currency) that has repeatedly suppressed interest rates, socialized downside risk, and incentivized leverage?
For more than a decade, U.S. monetary policy has leaned on very low policy rates, often below inflation. Large scale asset purchases and explicit and implicit backstops whenever volatility threatened to spill over into the real economy.
That did not create wealth ex nihilo, but rather it changed incentives. Corporations were rewarded for financial engineering and buybacks over careful capital allocation. Investors pushed out the risk curve in a forced “search for yield.” Asset prices learned that large drawdowns are politically destabilizing and therefore likely to be cushioned.
The USA has run that playbook long enough, that investors should not be surprised when the U.S. equity market cap grows much faster than the underlying money supply, or other developed markets, with different policy mixes and demographics, lag behind. A chart of market cap to M2 shows that the U.S. line is ripping away from the pack.
From a libertarian point of view, this is exactly what investors should expect when a central authority tries to manage outcomes rather than rules.
Investors can’t eliminate risk, they can only move it. Some risk shows up in stretched valuations, while some risk shows up in fragile politics. Right now we are seeing risk showing up in a generation of investors who have never seen what real price discovery looks like in the absence of a put. If investors were early to Bitcoin, they know what I am talking about. In the last cycle, Bitcoin barely made the gains it did in the previous cycles and that is directly due to derivatives markets using a single Bitcoin multiple times. The limited 21 million Bitcoin supply no longer matters when the Financial sector has built an entirely new layer on top of Bitcoin using derivatives.
As a portfolio manager, my job is not to scream “BUBBLE” at every new high. It’s to translate structural signals into risk and positioning decisions. Below is how this chart and the 270% reading feed into risk and positioning decisions.
I treat broad U.S. equity exposure as expensive relative to domestic liquidity, rather than unownable. That means higher hurdles for adding passive beta.
I lean toward exposures with real cash flows, real assets, and durable pricing power over long duration stories, that only work if rates stay artificially suppressed.
I pay more attention to markets like the U.K., Japan, and parts of Europe where the equity to M2 ratio still lives below 1.0. Europe has their own problems, but the claims stack relative to money supply, is less extended.
I separate short-term trading views from long-term regime risk. A market that is structurally stretched can still rally further, but the distribution of future returns is different.
In practice, this pushes me toward being more selective with stock picking and factoring in exposure in the U.S.A. I use hedges and optionality to manage tail risks. I also constantly audit how much of my P&L is implicitly a bet on the credibility of U.S. monetary and fiscal policy. The chart doesn’t tell me what the S&P 500 will do next month. It tells me what kind of world I’m compounding in over the next decade.

“More money than fools or more fools than money?” is tongue in cheek, but it hits a real question.
In a genuinely free market with hard constraints on money creation, investors would expect a tighter tether between the money supply, nominal growth, and equity valuations. Booms and busts would still happen, but there’d be less room for multi cycle financial inflation, to push claims structurally away from their base.
In a world where central banks and treasuries are willing to intervene aggressively, investors can push that tether much farther. Losses get socialized via inflation, repression, or through future taxes. Gains remain privatized for those who are levered into the trend. The political system becomes addicted to high asset prices as a proxy for “health.” The U.S. market cap to M2 ratio near 270% with peers below 100% reads, to me, like a scoreboard of how far we’ve run that game up.
As a libertarian quant, my response isn’t to cheer for a crash. It’s to build systems that assume, intervention can delay reality, sometimes for years however, it cannot repeal arithmetic. When risk finally reprices, nobody is obligated to make hedge funds whole.
So I manage risk as if nobody is coming to save me, and all retail investors should invest in this fashion. Retail investors can’t get a massive loans to cover their position, while they are waiting for their other positions to be closed out in order to not get margin called. Remember what part of the game investors are in, because the investing game becomes more like a game of chess at the
This article is for educational and informational purposes only. It does not constitute financial, investment, or trading advice, and it should not be relied on to make any specific decision. Trading or investing—including in equities, futures, or other leveraged instruments—involves significant risk, including the risk of total loss. Most short-term and intraday traders lose money over time. Always perform your own research, consider your personal financial situation and risk tolerance, and consult a qualified, licensed financial professional before making any investment decisions.

MSCI USA Index – A broad, float-adjusted equity benchmark covering large- and mid-cap U.S. stocks, often used as a proxy for the total U.S. equity market.
M2 money supply – A measure of the U.S. money stock that includes cash, checking deposits, savings deposits, and certain money-market balances, published by the Federal Reserve.
Market capitalization – The total value of a company’s or index’s outstanding shares, calculated as price times shares outstanding.
Liquidity in financial markets – The ease with which assets can be bought or sold in size without causing major price changes.
Dot-Com bubble – A late-1990s period marked by extreme valuations in technology and internet stocks, followed by a sharp collapse.
Austrian school of economics – A school of thought emphasizing individual choice, capital structure, time preference, and skepticism of discretionary central-bank policy.
Sound money – Money that is stable in value and resistant to political manipulation, often associated with commodity-backed or rule-based monetary systems.
Risk premium – The extra return investors demand for holding a risky asset relative to a risk-free benchmark.
Leverage – The use of borrowed capital or financial derivatives to increase the potential return, and risk, of an investment.
Risk management – The process of identifying, measuring, and managing financial risks through position sizing, diversification, hedging, and other tools.
Educational Disclaimer
This article is for educational and informational purposes only and does not constitute investment advice. Trading and investing—especially in futures and other leveraged instruments—entails substantial risk, including the risk of total loss. A standard futures risk disclosure, notes investors may sustain a total loss of funds deposited to establish or maintain a futures position, and investors may lose more than their initial deposit. (fiadocumentation.org) Most short term or intraday traders lose money over time, and day trading can involve severe financial losses. (SEC) Investors need to consider their own financial situation and risk tolerance. Investors should consult a qualified, licensed, financial professional before making any investment decisions.