NQ FUTURES: Trigger 25,659.25, Pivot 25,659.25, Guardrail 25,520.00 (11/11/2025)
A memo from the desk of a hedge fund manager to his team on the trading floor outlining todays Mechanical Playbook
Technical Analysis contained in this post was performed manually by Andrew Jodice of Markets, Liberty, & Discipline. He’s studied and blends Al Brooks’ theory, Richard D. Wyckoff’s theory, and Charles H. Dow’s theory to conduct his analysis, and implements Al Brooks’ strategy to execute trades.
This Section of the Article is for Free Subscribers.
Executive summary

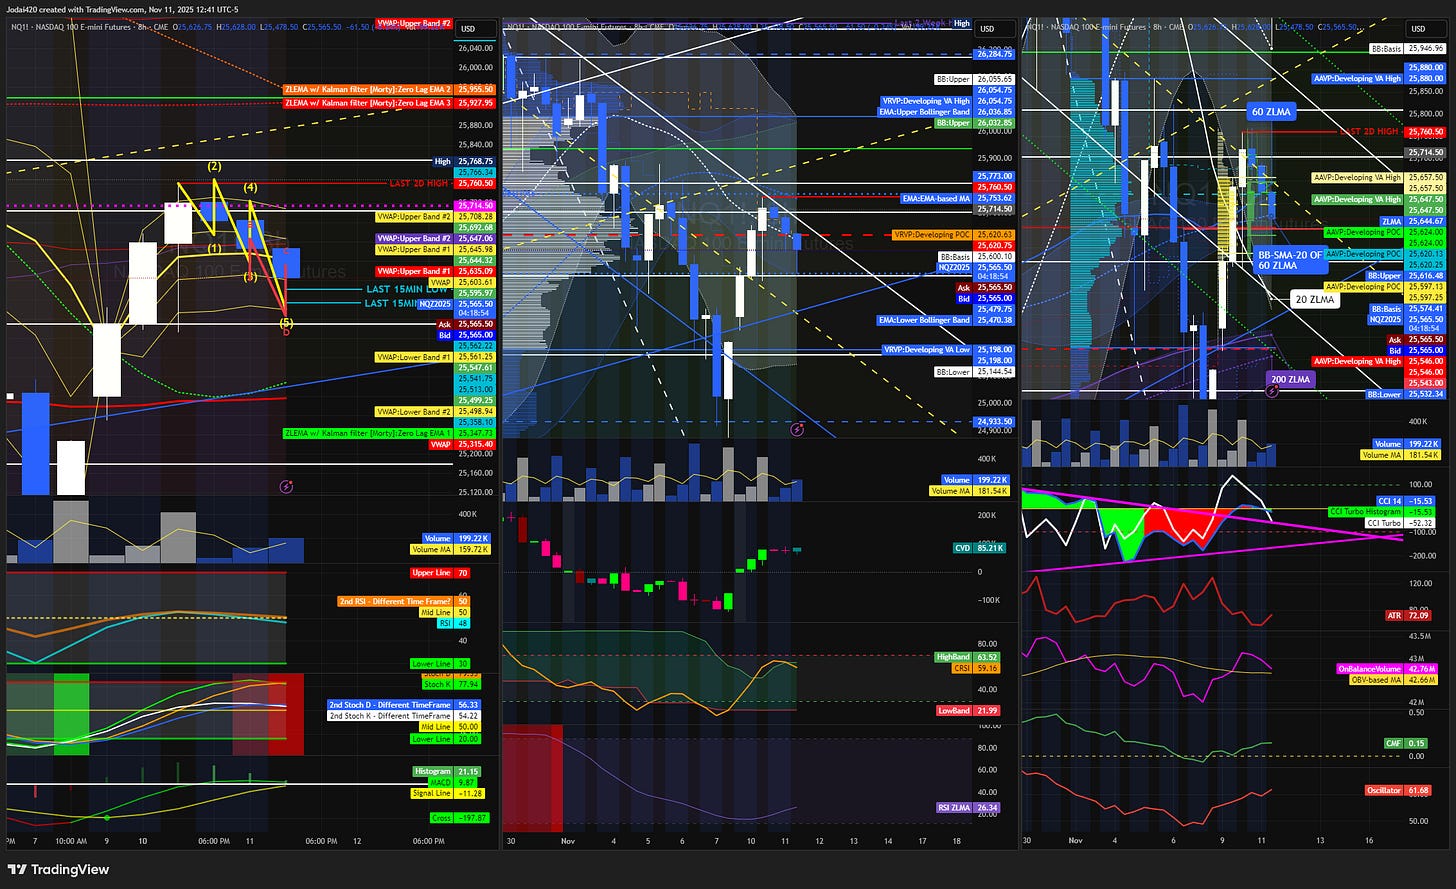
NQ is range-bound around the fifteen-minute Auto-Anchored Volume Profile point of control. The risk-on gates are open while the United States Dollar Index is weak and the in-house volatility monitor is low, but momentum is mixed at value. The practical read: only press longs on strength through the value-area high with money-flow confirmation; fade moves back toward the point of control while price remains inside value; take shorts only on a firm break of the value-area low.
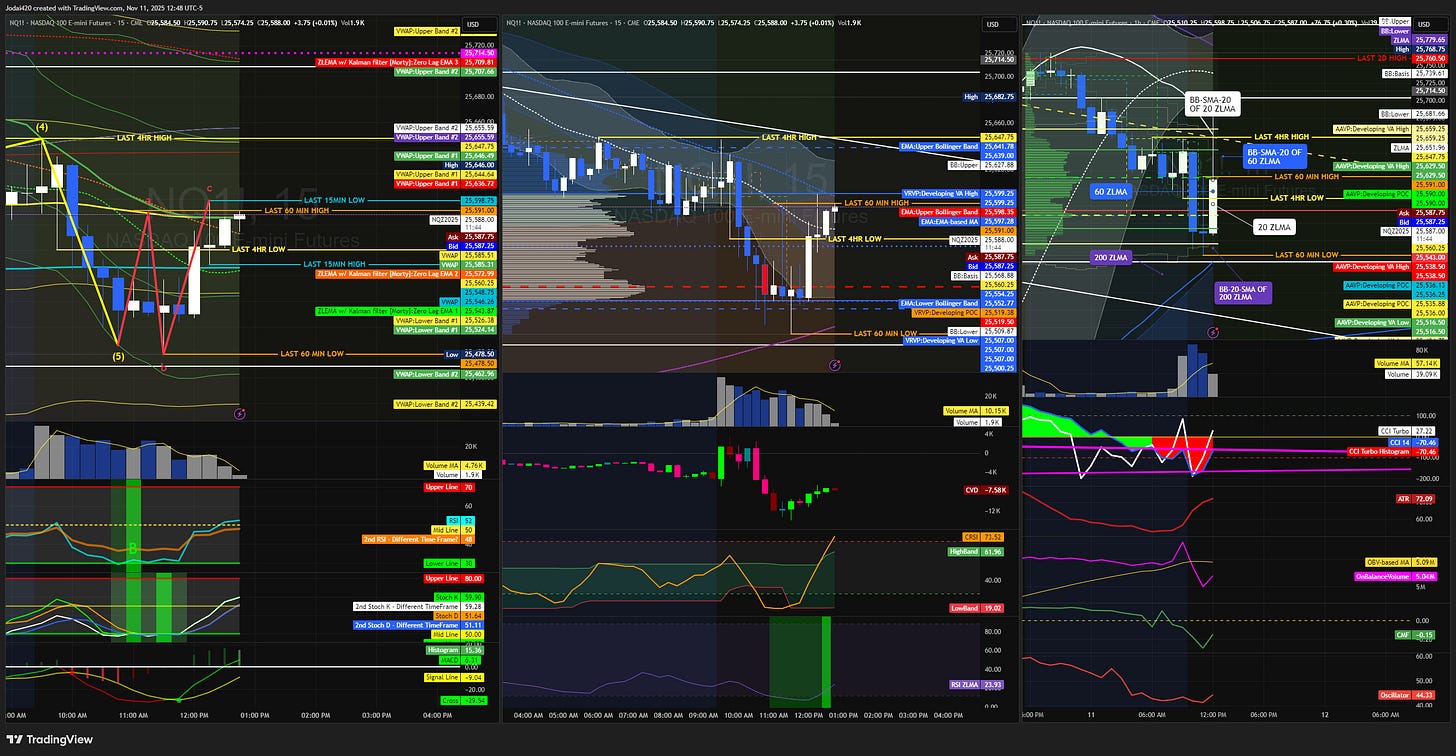
NQ operating map (15-minute AAVP + references)

Value-Area High (VAH): 25,659.25.
Point of Control (POC): 25,591.00.
Value-Area Low (VAL): ≈25,523. Note: approximated by symmetry because the VAL label is not legible on the capture provided.
Why this order of operations: Cross-asset gates set directional bias; key market profile levels define where trades should trigger or fail; confirmations and risk convert the map into an executable plan.
Desk note:
Use the triggers and invalidations verbatim. Adjust directional bias in real time with DXY, VINMO, ZB, and XAU. If DXY rises above 100.50 or VINMO rises above 18 during U.S. hours, reduce risk immediately.
Review of Yesterday’s Call & Improvements
Lets take a look at yesterday’s post “NQ Futures Playbook — 25,597.25 trigger, 25,955 pivot, 25,480.00 guardrail (11/10/25)” posture emphasized trading “inside value back to POC” unless the value-area edges broke on a closing basis. Market behavior remained rotational, validating the emphasis on mean-reversion tactics and patience at the edges.
The main improvement for today is to require both the VWMA/SMA confirmation sequence and Chaikin Money Flow moving out of the ±0.05 noise band before pressing any breakout or breakdown. This reduces false starts common near value edges.
Key levels
VAH: 25,659.25.
POC: 25,591.00.
VAL: ≈25,523. Approximated by symmetry; treat as provisional until replaced with the exact label.
Regime confirms:
VWMA/SMA Breakout Detector (13/26): treat VWMA(13) > VWMA(26) as a breakout only if SMA(13) > SMA(26) follows within three candles on this timeframe; opposite for bearish.
CMF(20): ±0.05 noise band; ≥ +0.10 confirms risk-on entries; ≤ −0.10 confirms risk-off entries. Divergence only tightens risk.
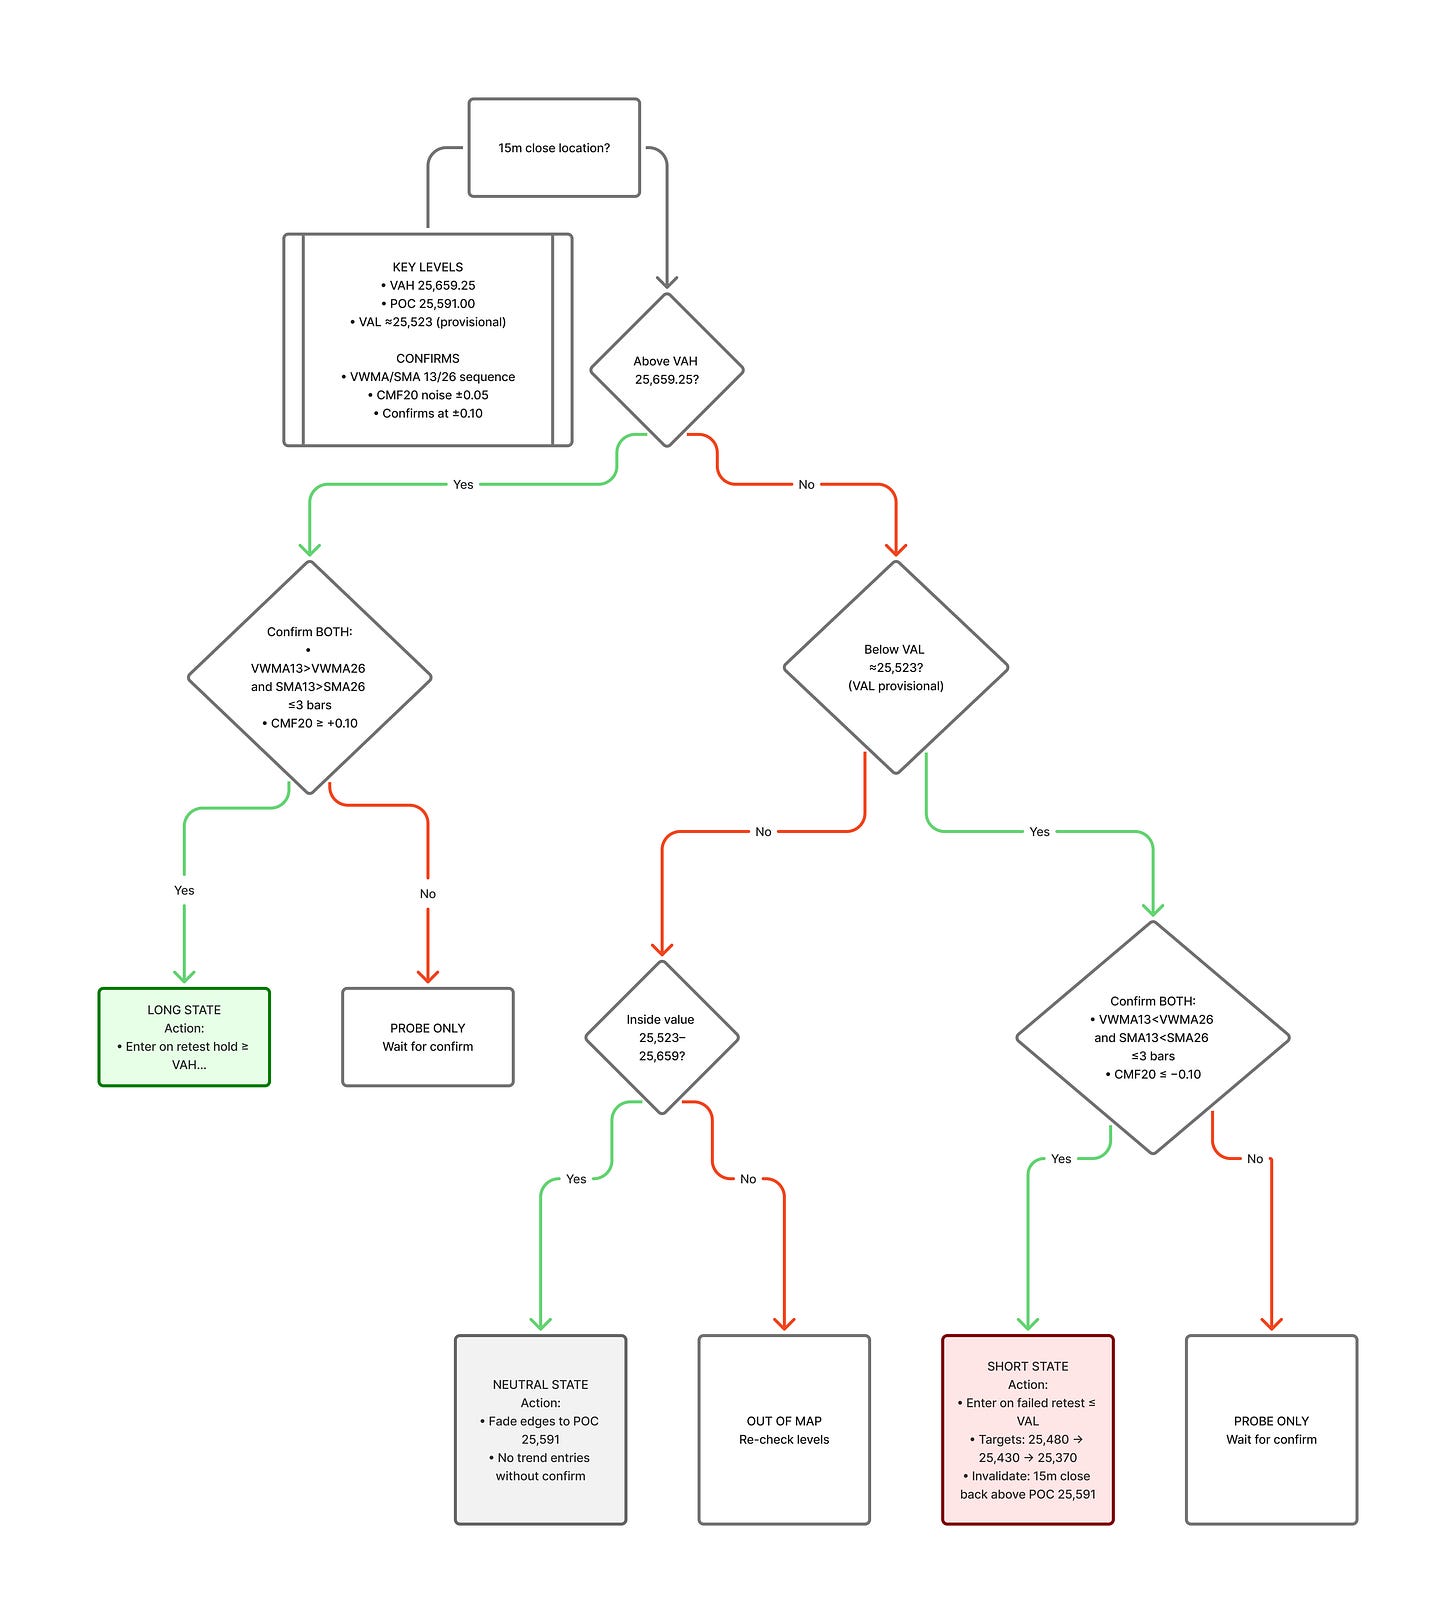
Decision tree for NASDAQ Futures (Free)
If a fifteen-minute bar closes above 25,659.25 and a quick retest holds at or above 25,659.25, consider a long for continuation toward 25,700, then 25,760, then 25,880. Invalidate the idea on a fifteen-minute close back inside value. Require CMF(20) ≥ +0.05 and the VWMA/SMA confirmation sequence.
If price trades down into ≈25,523–25,591 and momentum turns up while CMF(20) is inside the ±0.05 noise band, consider a fade back toward 25,591 with a stretch objective to 25,659. Invalidate on a decisive break and close below ≈25,523.
If a fifteen-minute bar closes below ≈25,523, consider a short toward 25,480, then 25,430, then 25,370. Invalidate on a fifteen-minute close back above 25,591. Require CMF(20) ≤ −0.05 and the VWMA/SMA bearish confirmation sequence.


