

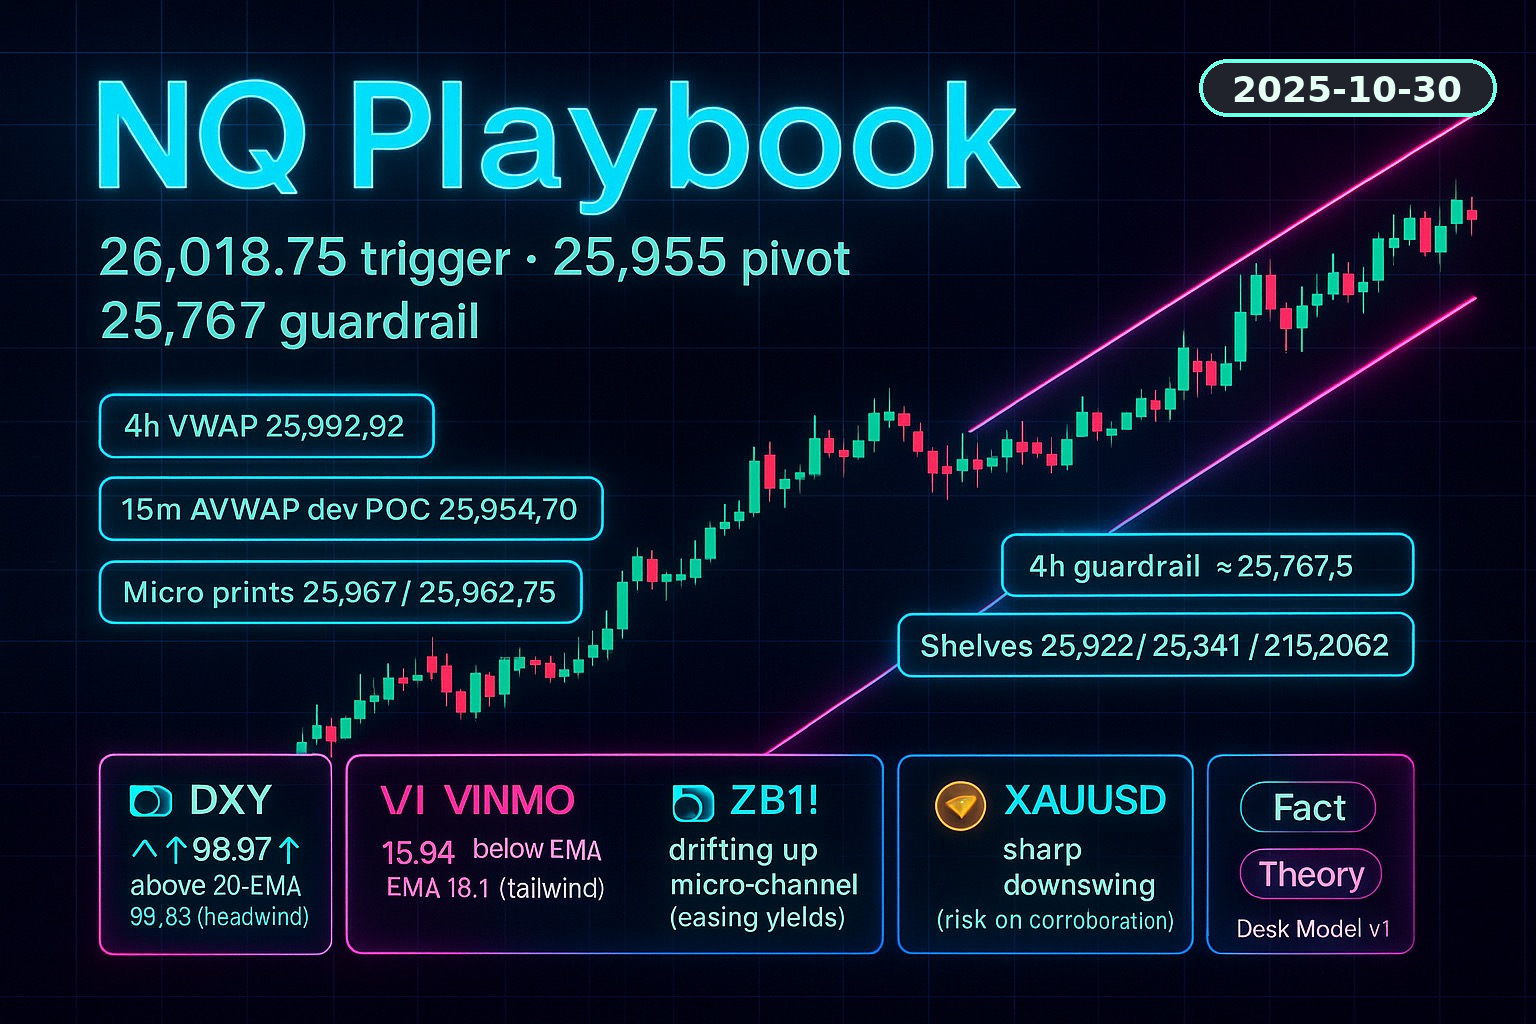
NQ Futures Playbook: Trigger 26,018.75, Pivot 25,955, Guardrail 25,767.5 (10/30/2025)
A hedge fund desk brief to the inner circle with predictions for daily pivot times over the lunch hour

Technical Analysis contained in this post was performed manually by Andrew Jodice of Markets, Liberty, & Discipline. He’s studied and blends Al Brooks’ theory, Richard D. Wyckoff’s theory, and Charles H. Dow’s theory to conduct his analysis, and implements Al Brooks’ strategy to execute trades.
This Section of the Article is for Free Subscribers.
Executive Summary
Bias is mildly positive while the United States Dollar Index is not advancing and while equity volatility is subdued. [Theory]
Momentum becomes active above 26,018.75. Balance favors two-way trading between 26,018.75 and 25,955. Control shifts to sellers below 25,955, with the four-hour trend “guardrail” near 25,767.5 acting as the last line before a larger down move. [Fact]
Six-hour outlook: range inside 26,018.75 and 25,955 at 40 percent, breakout to the upside at 30 percent, breakdown below 25,955 at 30 percent. Twenty-four-hour outlook: breakout 42 percent, range 30 percent, breakdown 28 percent, provided the Dollar Index fails below about 100.53 and the volatility gauge “VINMO” remains below 18. [Theory]
Desk Note: use the triggers and invalidations verbatim, and adjust directional bias in real time with the DXY, VINMO, ZB-T Bonds, and XAUU.
Review of Yesterday’s Call & Improvements
We are building directly on NQ Futures Playbook: Trigger 26,018.75, Pivot 25,955, Guardrail 25,767.5 (10/29/2025). The same triggers govern today.
Improvements for execution: require a fifteen-minute close for breakouts and breakdowns, then trade the retest; throttle long size if the Dollar Index rises above 100.20; pause new longs if VINMO jumps above 18.
Key Levels / Takeaways
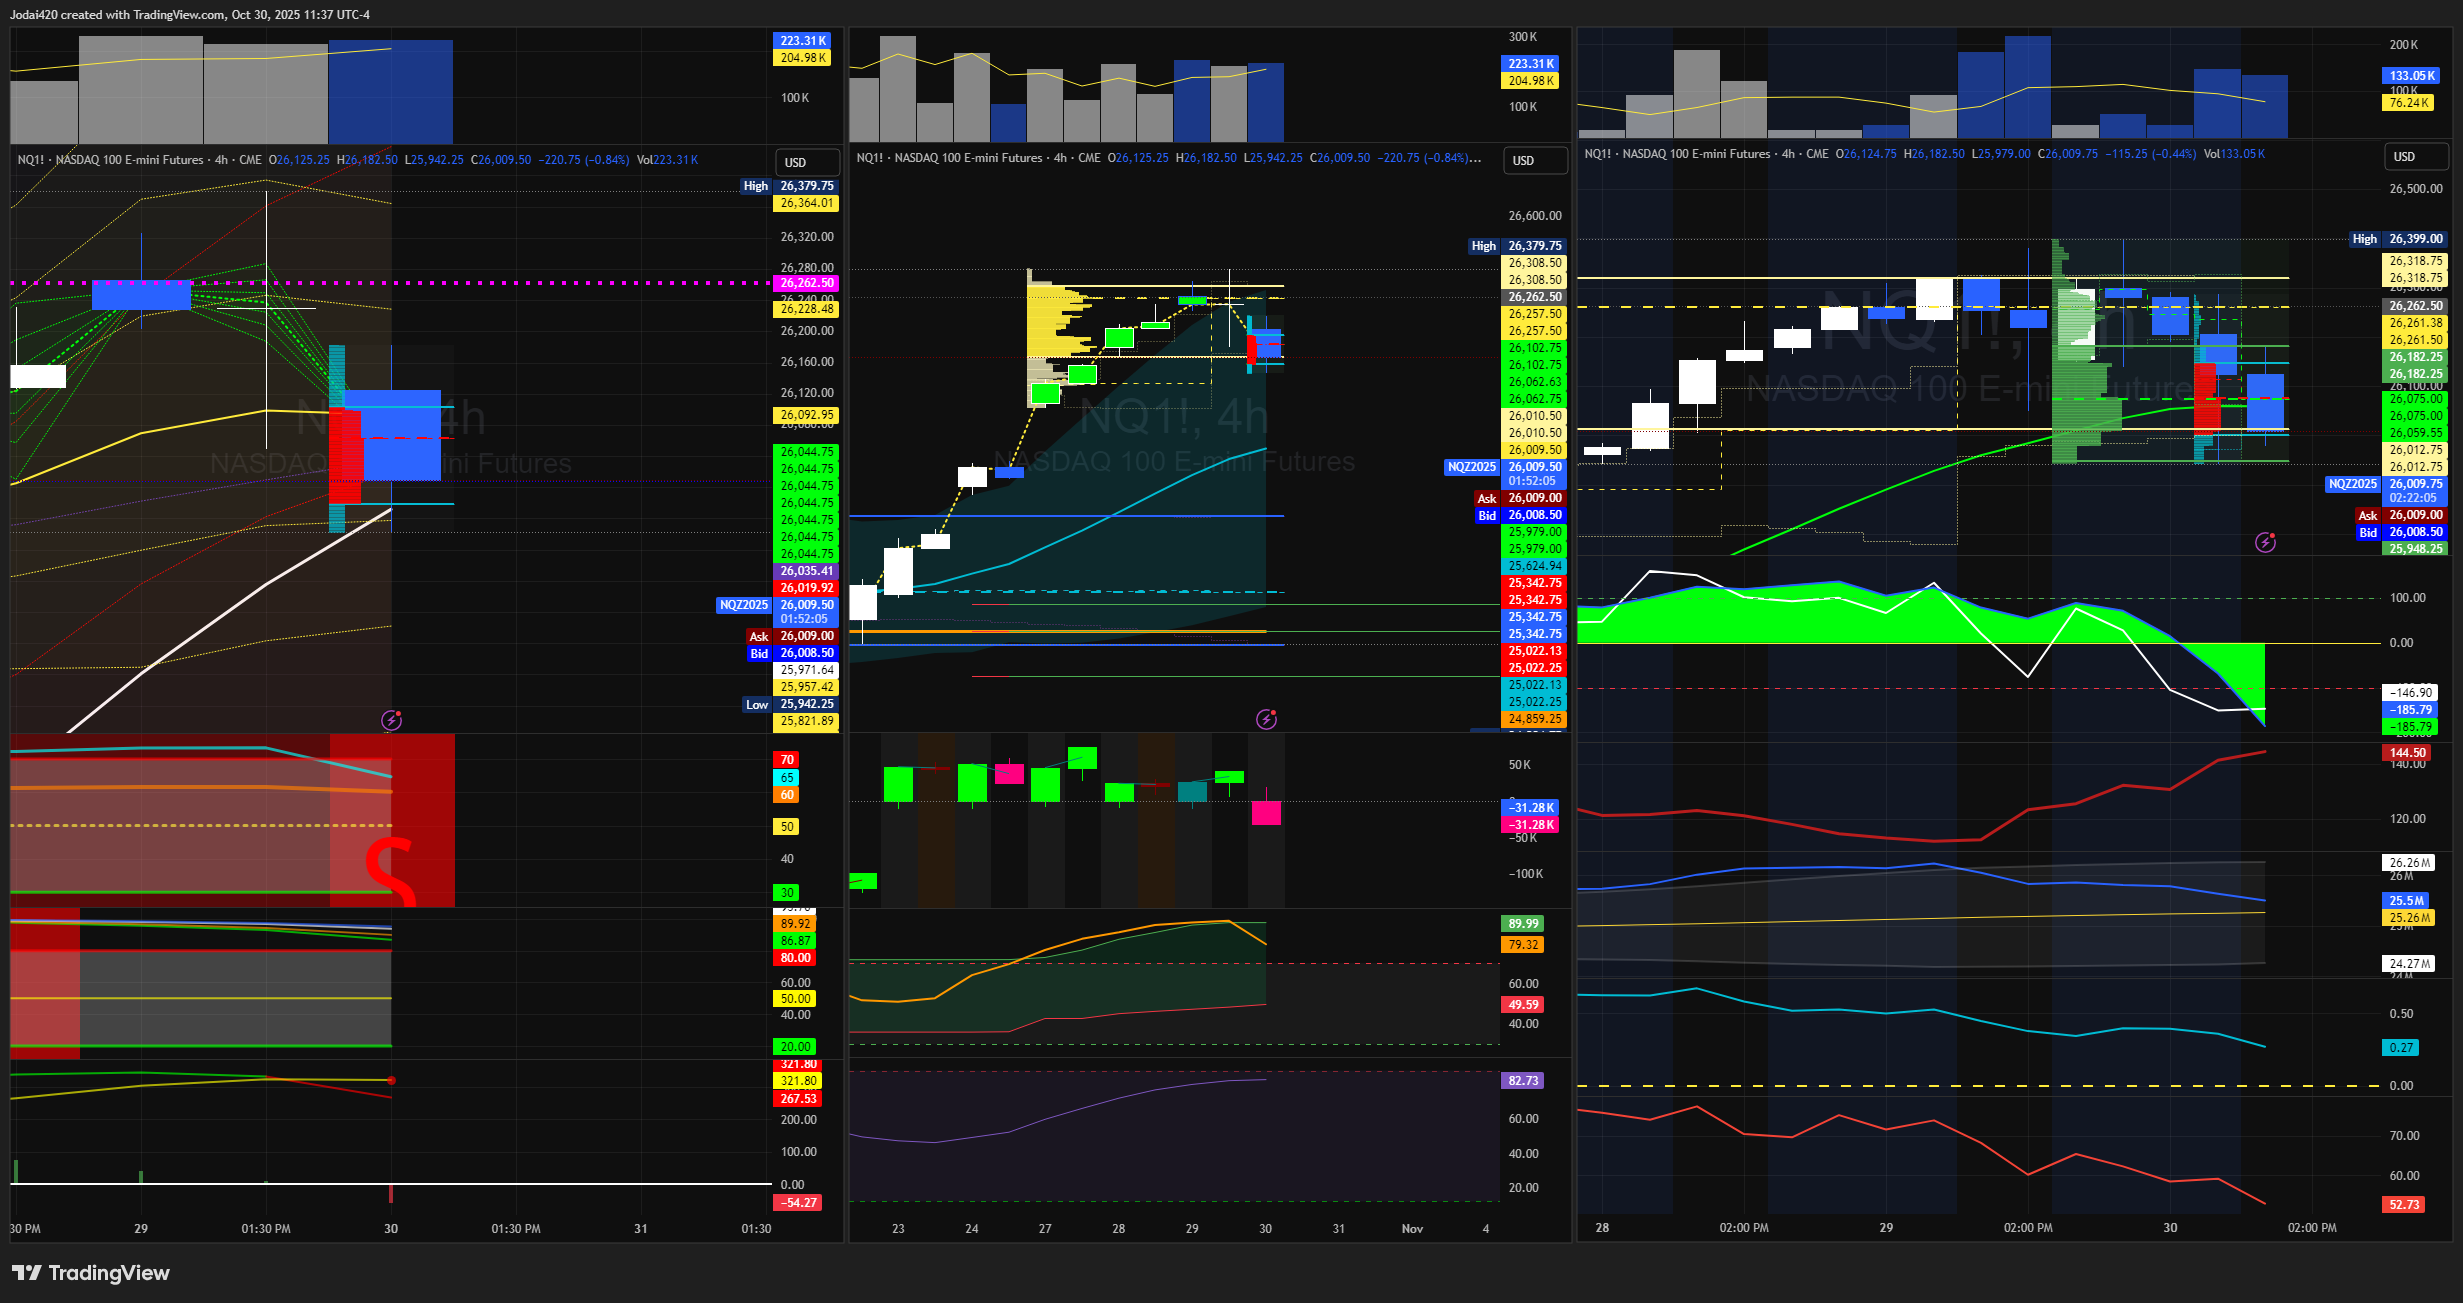
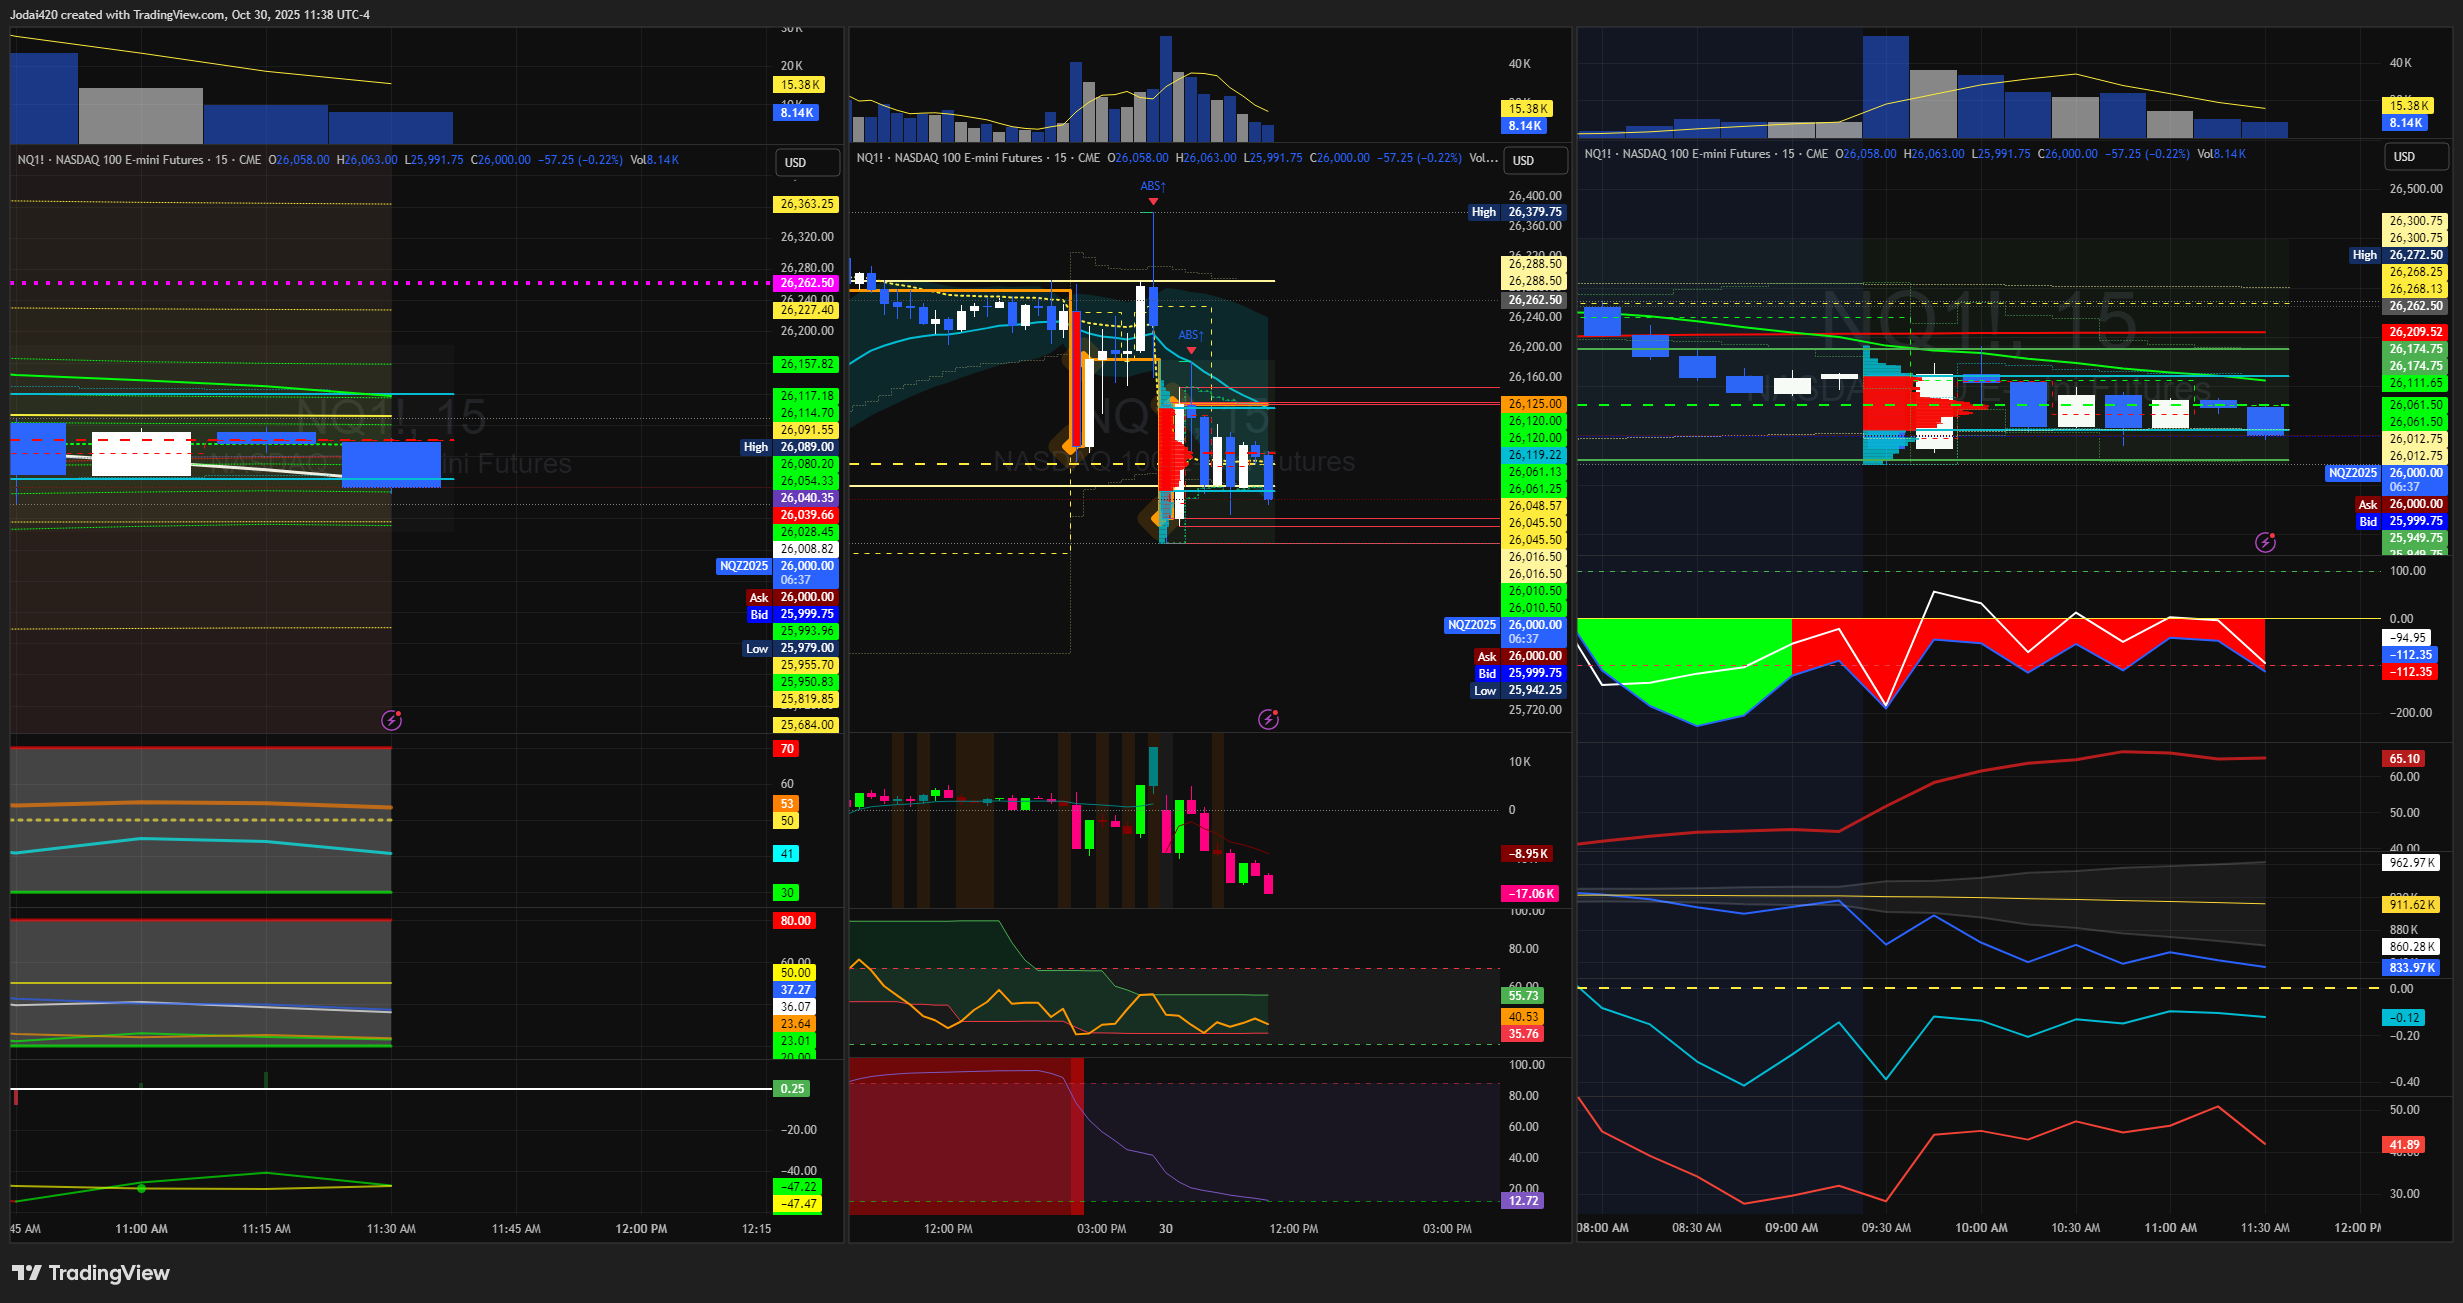
One-day swing trigger: 26,018.75. [Fact]
Four-hour volume-weighted average price: 25,992.92. [Fact]
Fifteen-minute anchored volume profile developing point of control: 25,954.70. [Fact]
Micro “prints” where price stalled: 25,967 and 25,962.75. [Fact]
Four-hour trend guardrail reference: approximately 25,767.5. [Fact]
Lower shelves marked on your charts: 25,592, 25,341, 25,323, 25,062. [Fact]
Plain English: above 26,018.75 favors buying pullbacks for continuation; between 26,018.75 and 25,955 favors patient two-way trades; below 25,955 favors short setups toward 25,820 and 25,767.5. [Theory]
Decision Tree ( Free )
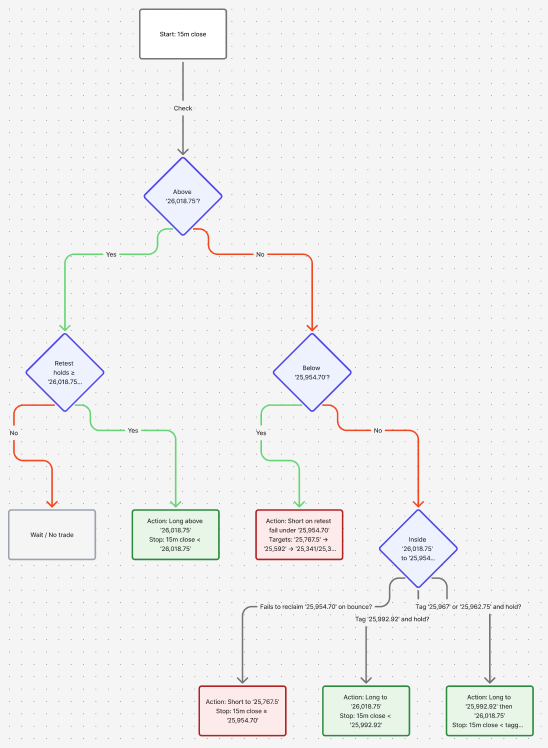
If a fifteen-minute bar closes above 26,018.75 and a quick retest holds at or above 26,005, consider a long for continuation toward 26,065, then 26,105, then 26,205. Invalidate the idea on a fifteen-minute close back below 25,955. [Theory]
If price trades into 25,967–25,955 and momentum turns up, consider a bounce back toward 25,995–26,019, with a stretch objective at 26,065. Invalidate on a decisive break below 25,945. [Theory]
If a fifteen-minute bar closes below 25,955, consider a short toward 25,905, then 25,820, then 25,767.5. Invalidate on a fifteen-minute close back above 25,985. [Theory]
Decision Tree ( Paid )
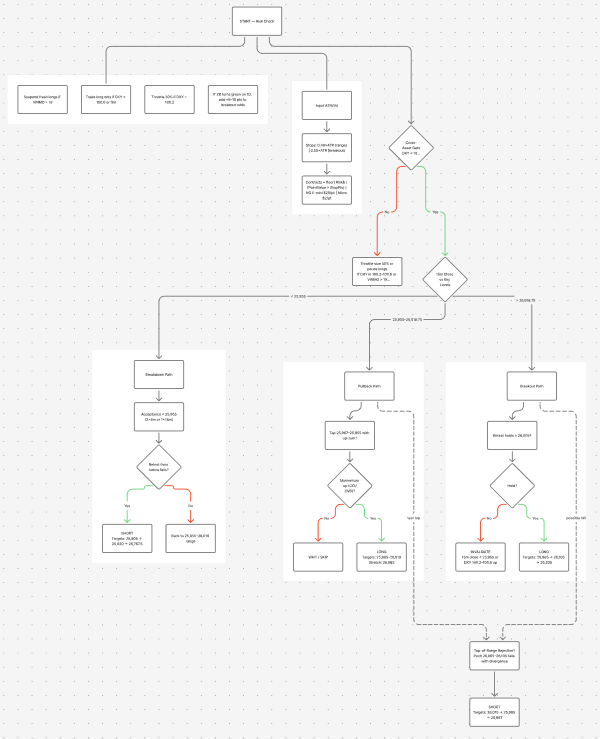
1) Cross-asset gate
If the Dollar Index is greater than 99.00 or if VINMO is rising and greater than 16.0, tilt bias to neutral or short. Otherwise hold a mild long bias. [Theory]
If VINMO spikes above 18.0, pause new long trades. [Theory]
2) State check (fifteen-minute close)
Breakout path — fifteen-minute close above 26,018.75
Requirement: quick retest holds at or above 26,005.
Action: go long. Targets 26,065, then 26,105, then 26,205.
Invalidation: fifteen-minute close below 25,955 or a Dollar Index push into the 100.20 to 100.60 band with momentum. [Theory]
Pullback path — inside 26,018.75 and at or above 25,955
If price tags 25,967–25,955 at the developing point of control and short-term momentum turns up, go long back to 25,995–26,019; stretch 26,065.
Invalidation: fifteen-minute close below 25,945 or momentum fails on the bounce. [Theory]
Breakdown path — acceptance below 25,955
Condition: two five-minute closes or one fifteen-minute close below 25,955 and failure on retest from underneath.
Action: go short. Targets 25,905, then 25,820, then 25,767.5.
Invalidation: fifteen-minute close back above 25,985. [Theory]
3) Regime flip
If ZB long-bond futures stabilize green on the one-day chart, upgrade upside breakout probability by five to ten percentage points. If ZB is red and making new session lows, downgrade upside continuation and favor fade-the-rally behavior near 26,065–26,105. [Theory]
4) Risk and sizing
Use an hourly average true range stop template: 0.40 times ATR for range trades, 0.55 times ATR for breakouts. Contracts = floor of (dollars at risk) divided by (point value times stop size in points). E-mini point value 20 dollars per point. Micro point value 2 dollars per point. [Fact/Theory]
Thesis and Setups
Thesis: Today is a balance-to-break scenario. Buyers have the advantage only with acceptance above 26,018.75. Sellers have the advantage only with acceptance below 25,955. Cross-asset conditions can tip the scale: a stronger dollar and weaker bonds are headwinds for equities; a softer dollar and steady bonds are tailwinds. [Theory]
Setups
Long momentum above 26,018.75 after a confirmed retest that holds at or above 26,005. First objective 26,065, then 26,105, then 26,205. Invalidation: fifteen-minute close below 25,955. [Theory]
Long pullback inside 25,967–25,955 at the developing point of control when momentum turns up. Target 25,995–26,019, stretch 26,065. Invalidation: decisive break below 25,945. [Theory]
Short fade into 26,065–26,105 when momentum stalls and breadth or cumulative delta diverges. Target 26,015, then 25,995, then 25,967. Invalidation: fifteen-minute close above 26,118. [Theory]
Trend-break short on acceptance below 25,955 with a failed retest from underneath. Target 25,905, then 25,820, then 25,767.5. Invalidation: fifteen-minute close back above 25,985. [Theory]
Probabilities
Six-hour window: range 40 percent, breakout 30 percent, breakdown 30 percent. Twenty-four-hour window: breakout 42 percent, range 30 percent, breakdown 28 percent, contingent on the Dollar Index staying muted and VINMO staying below 18. [Theory]
What invalidates the playbook
Dollar Index acceptance in the 100.20 to 100.60 band with momentum.
VINMO spike above 18.
A one-bar fifteen-minute acceptance above 26,118 that immediately fails back under 26,018.75, or acceptance below 25,955 that fails back above 25,985. [Theory]
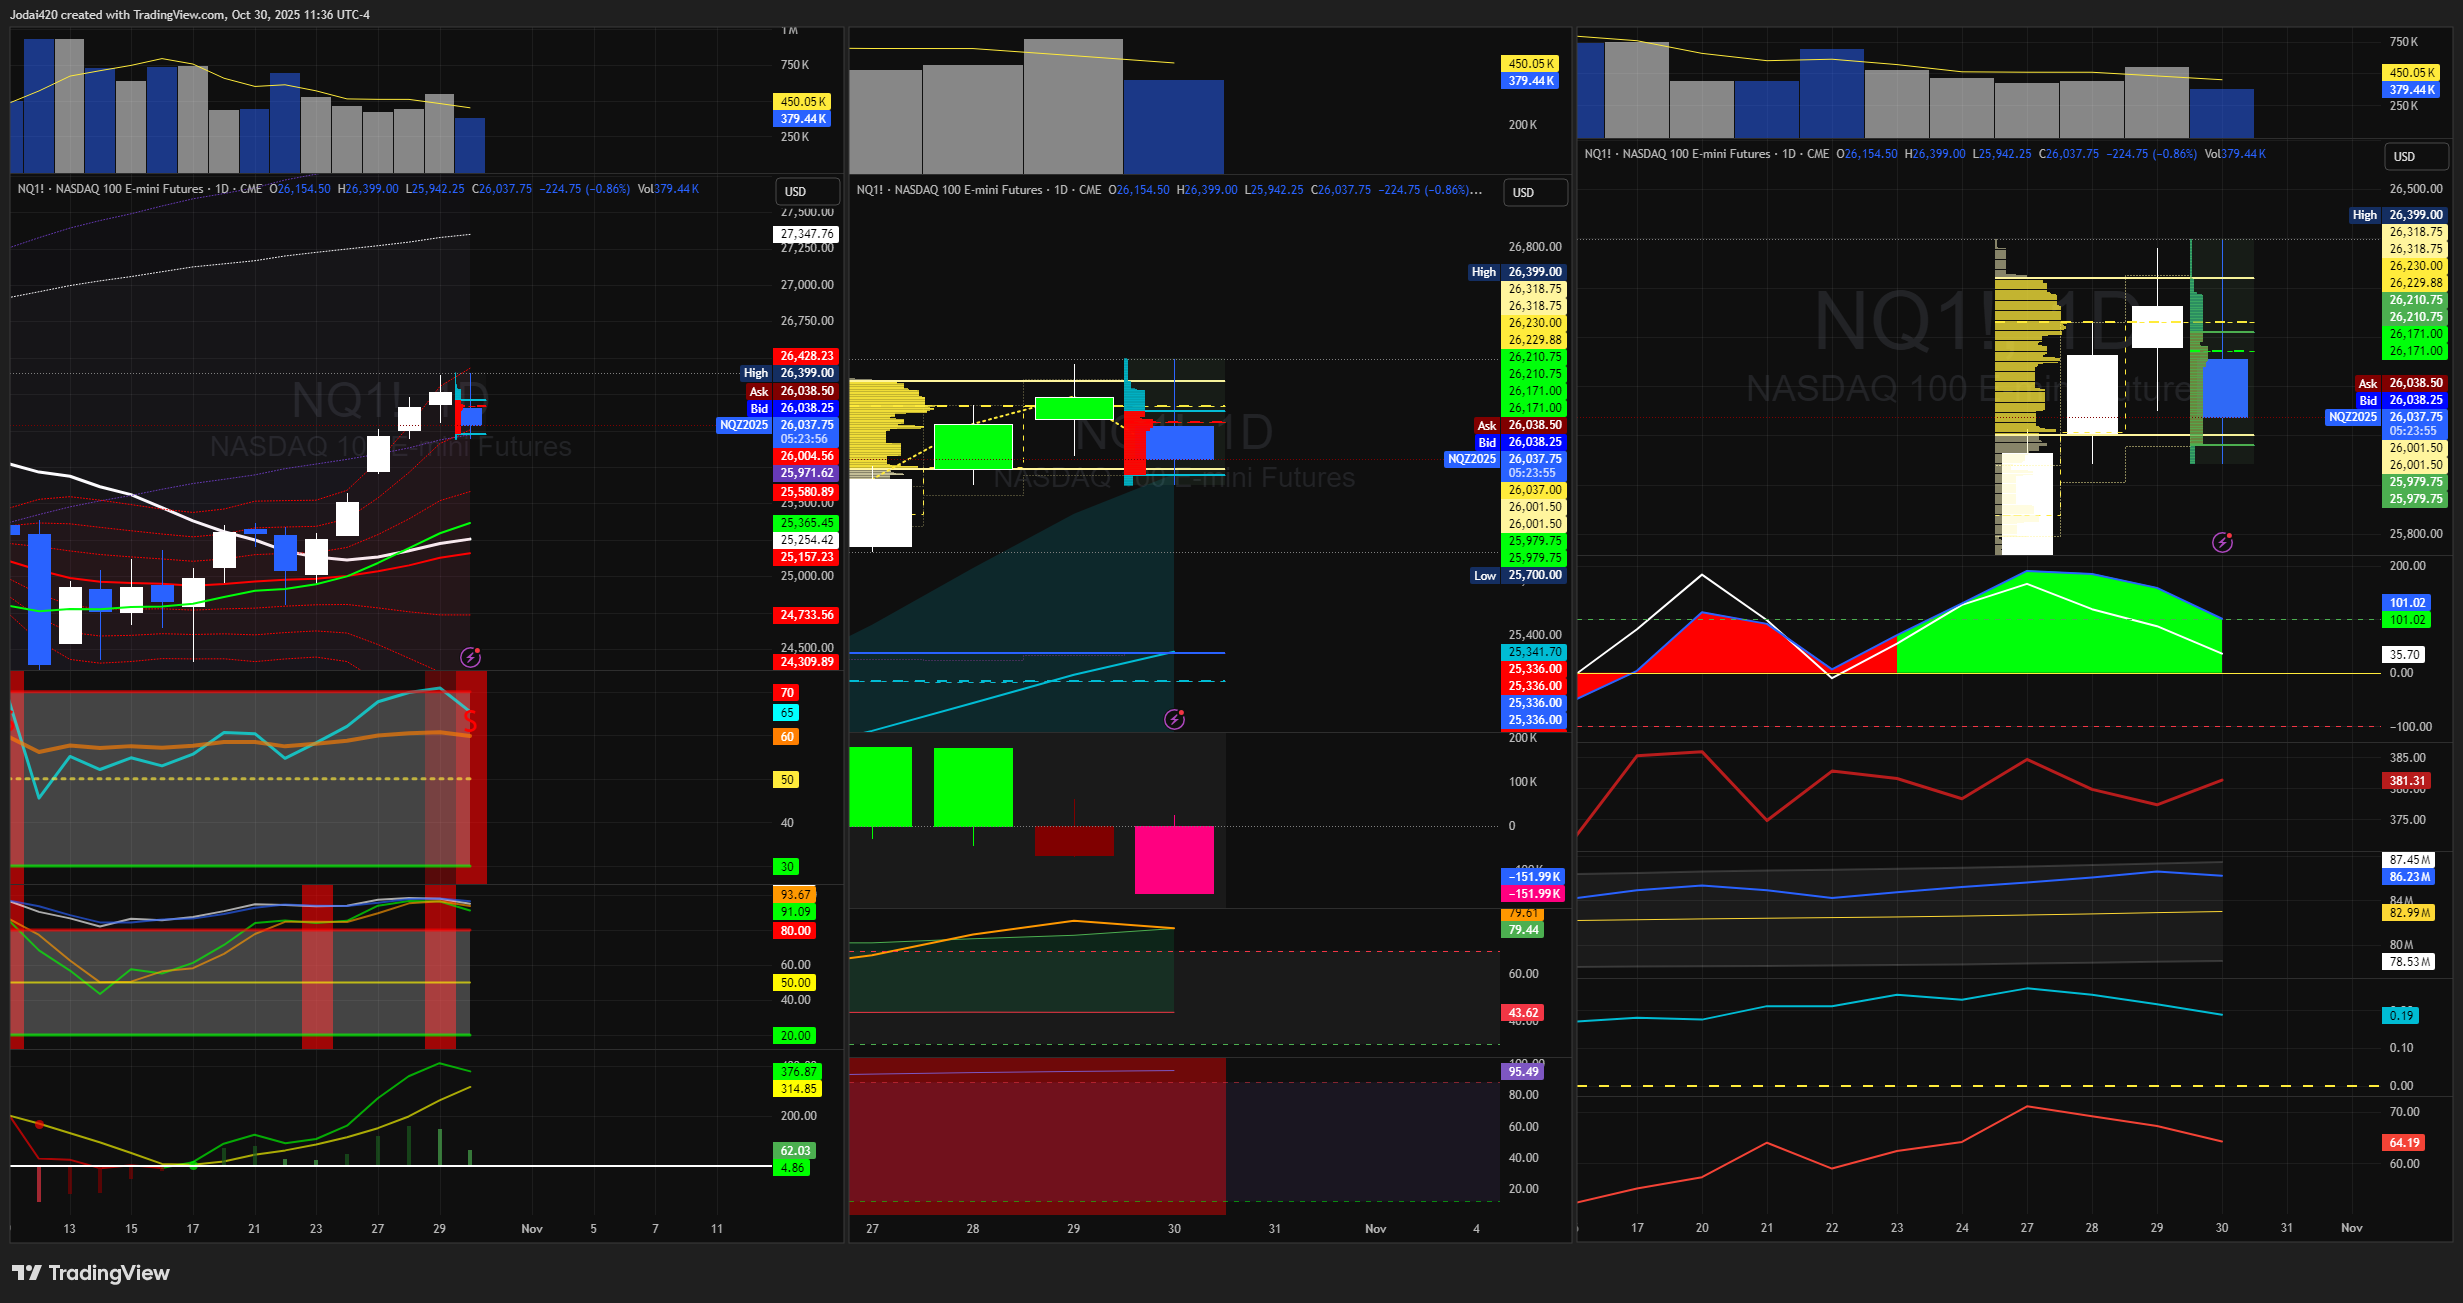
Evidence and Charts
Key levels — NQ1!
Trigger 26,018.75; four-hour VWAP 25,992.92; fifteen-minute developing point of control 25,954.70; micro prints 25,967 and 25,962.75; guardrail approximately 25,767.5; lower shelves 25,592, 25,341, 25,323, 25,062. [Fact]
Cross-asset filters — one-day
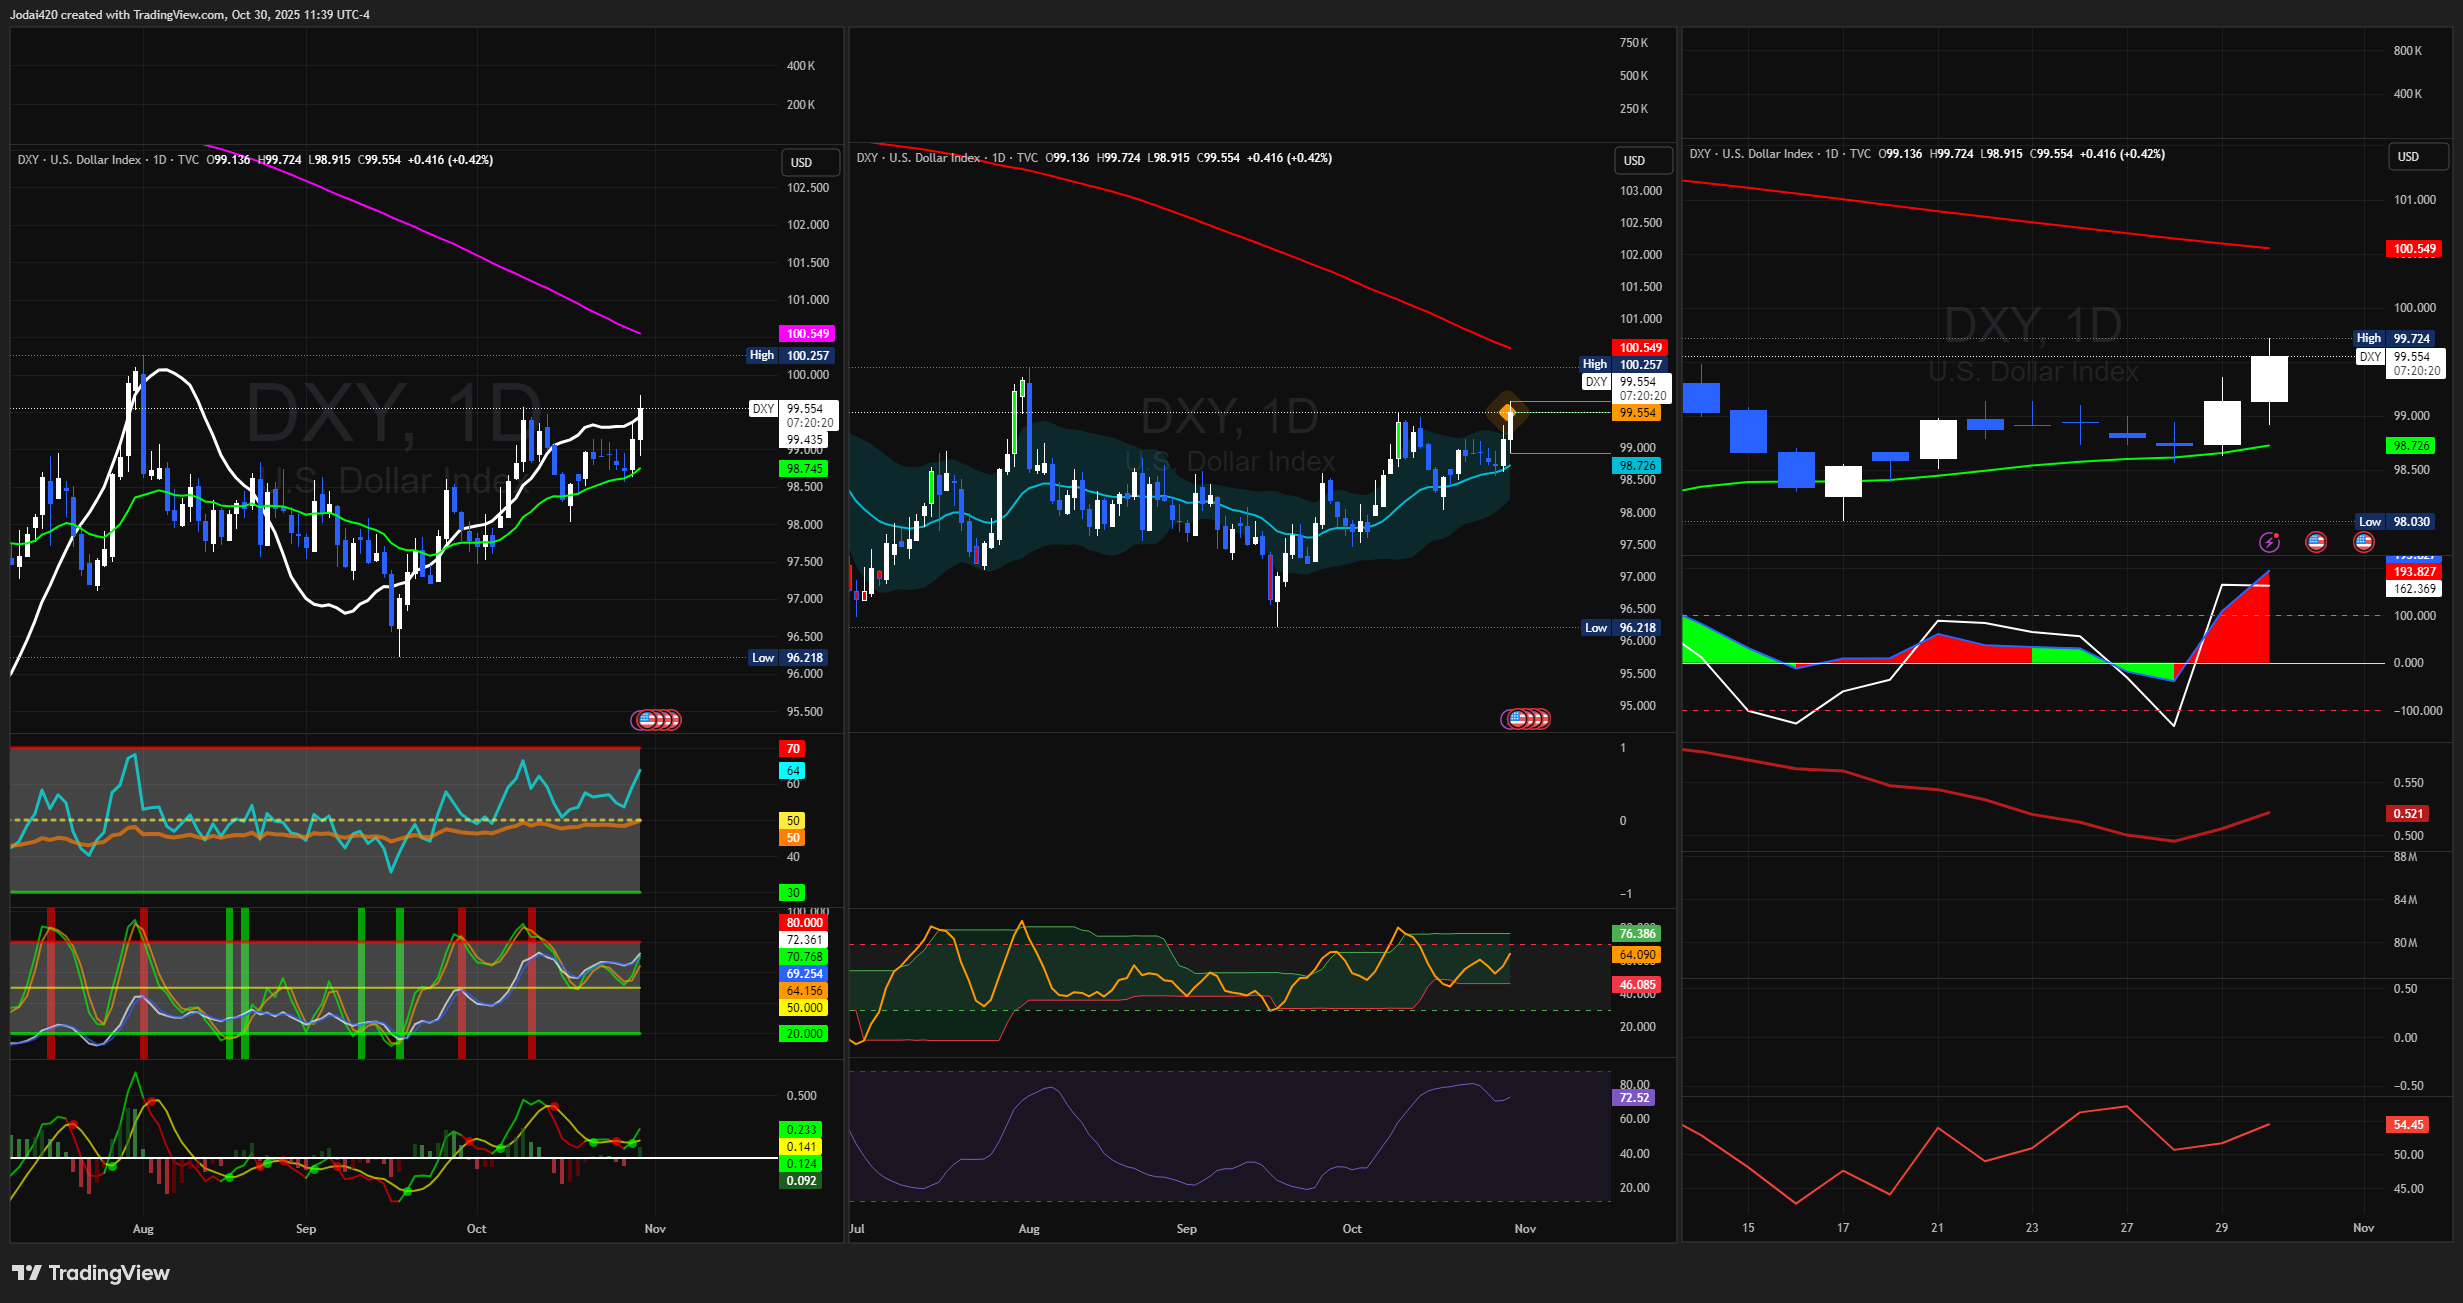
Dollar Index approximately 99.55 with labeled resistance at 100.527. Above short moving averages creates a headwind for equities. [Fact/Theory]
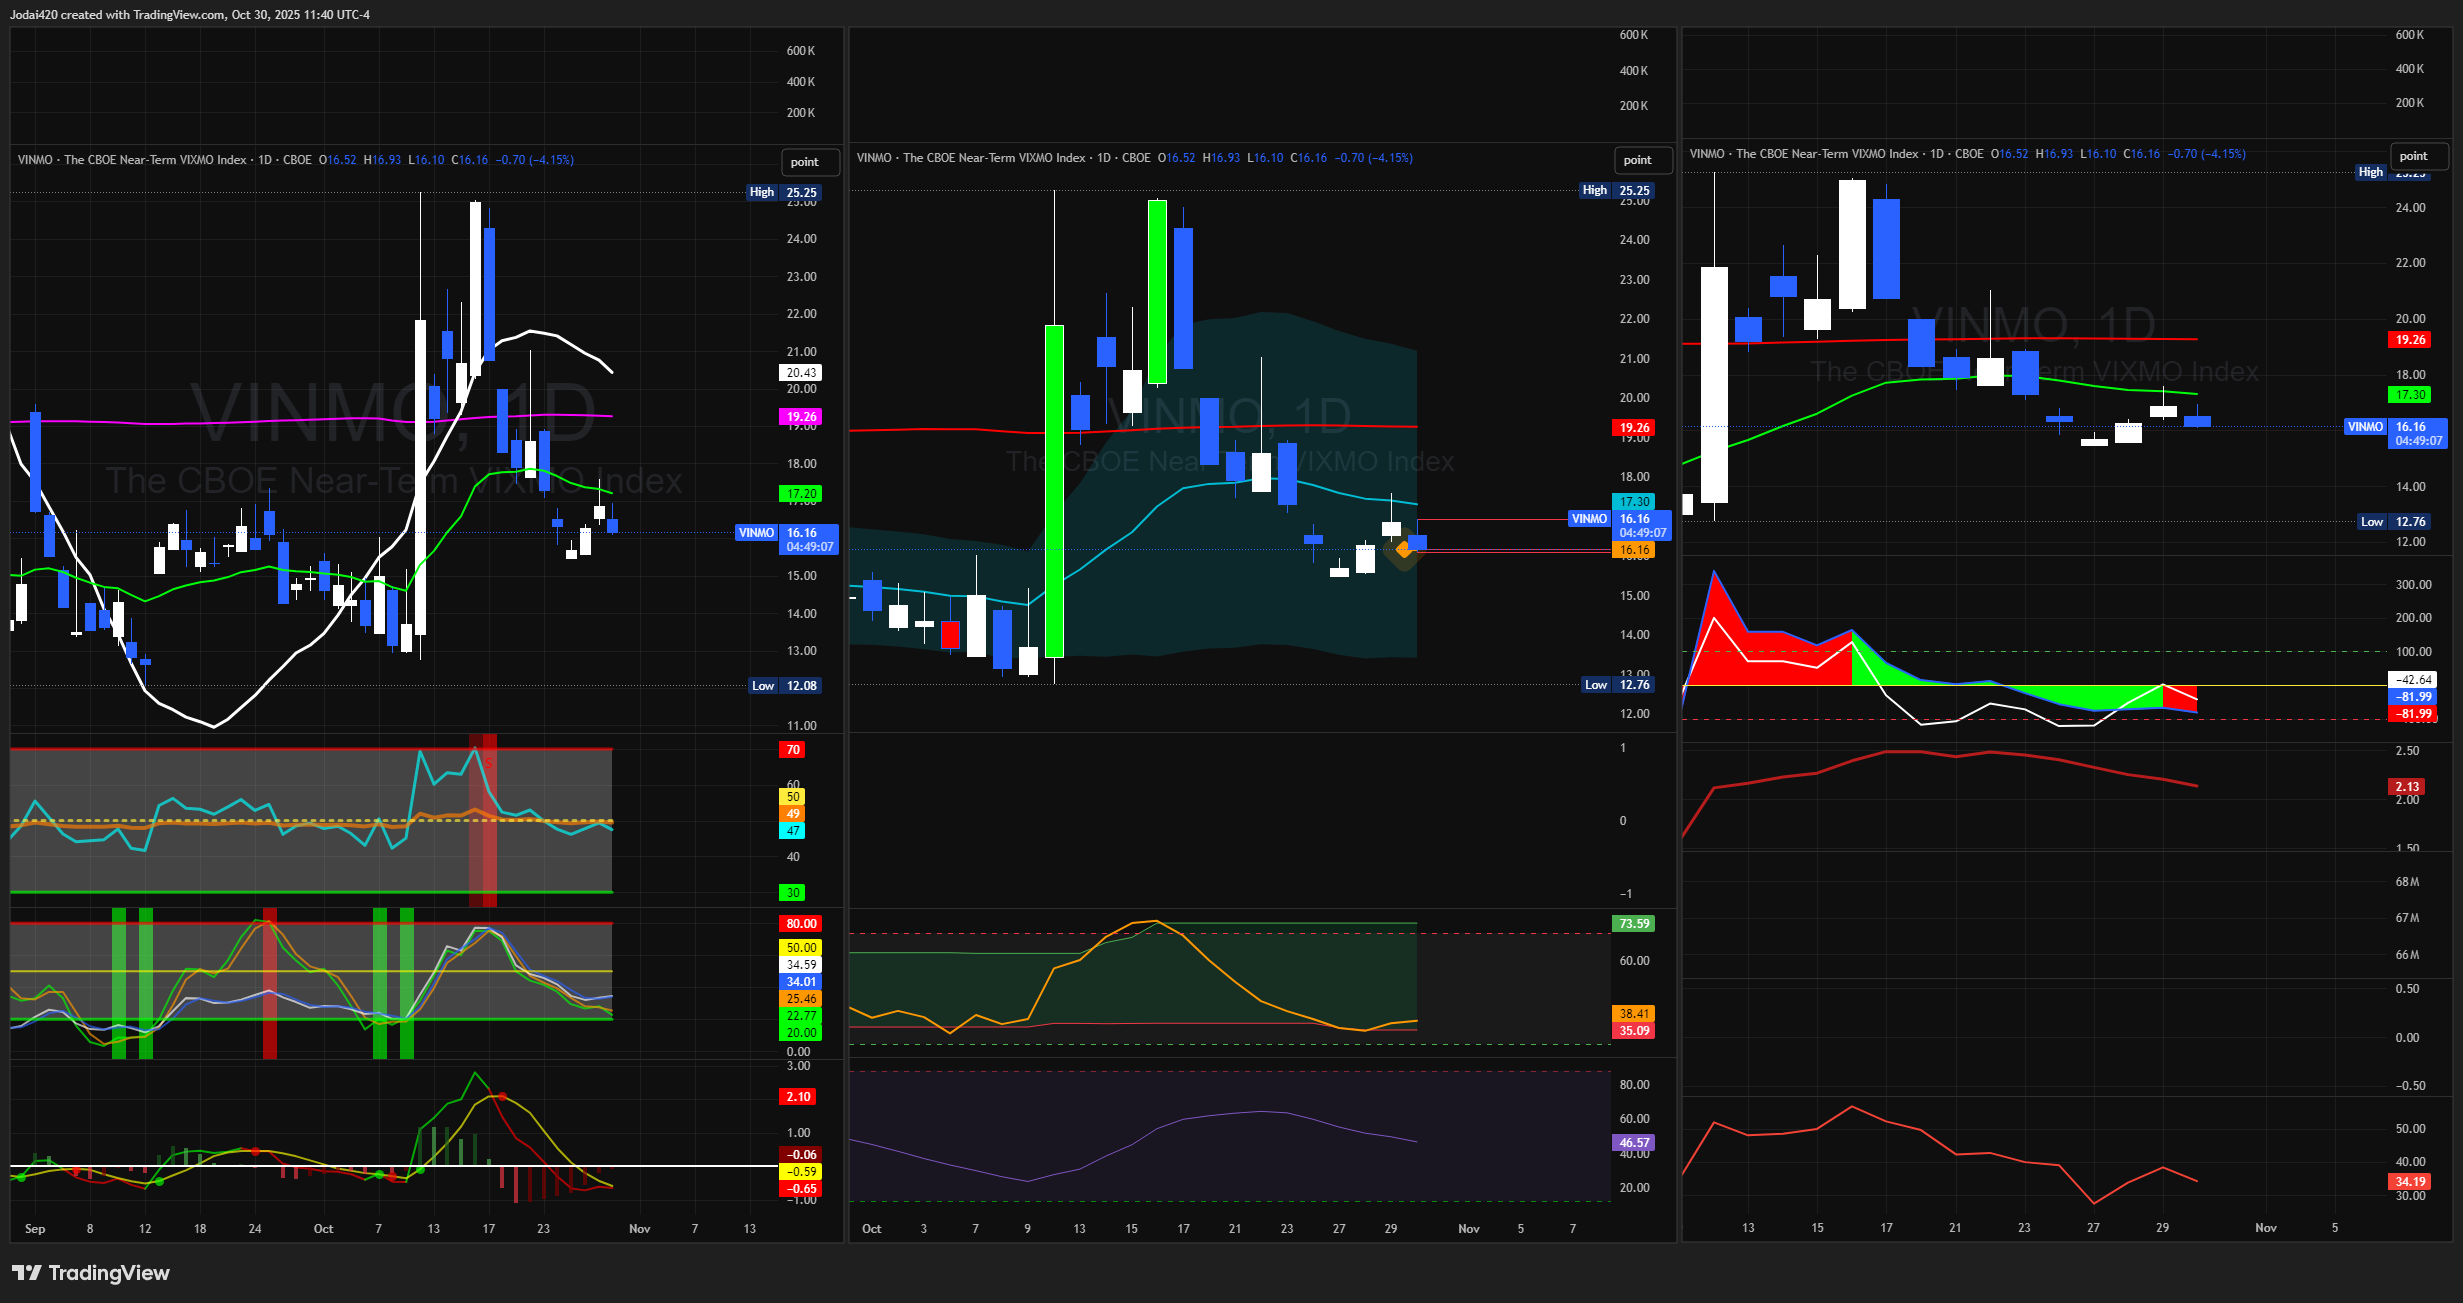
VINMO approximately 16.16, below its short moving average and below 18.00. That backdrop supports risk-taking. [Fact/Theory]
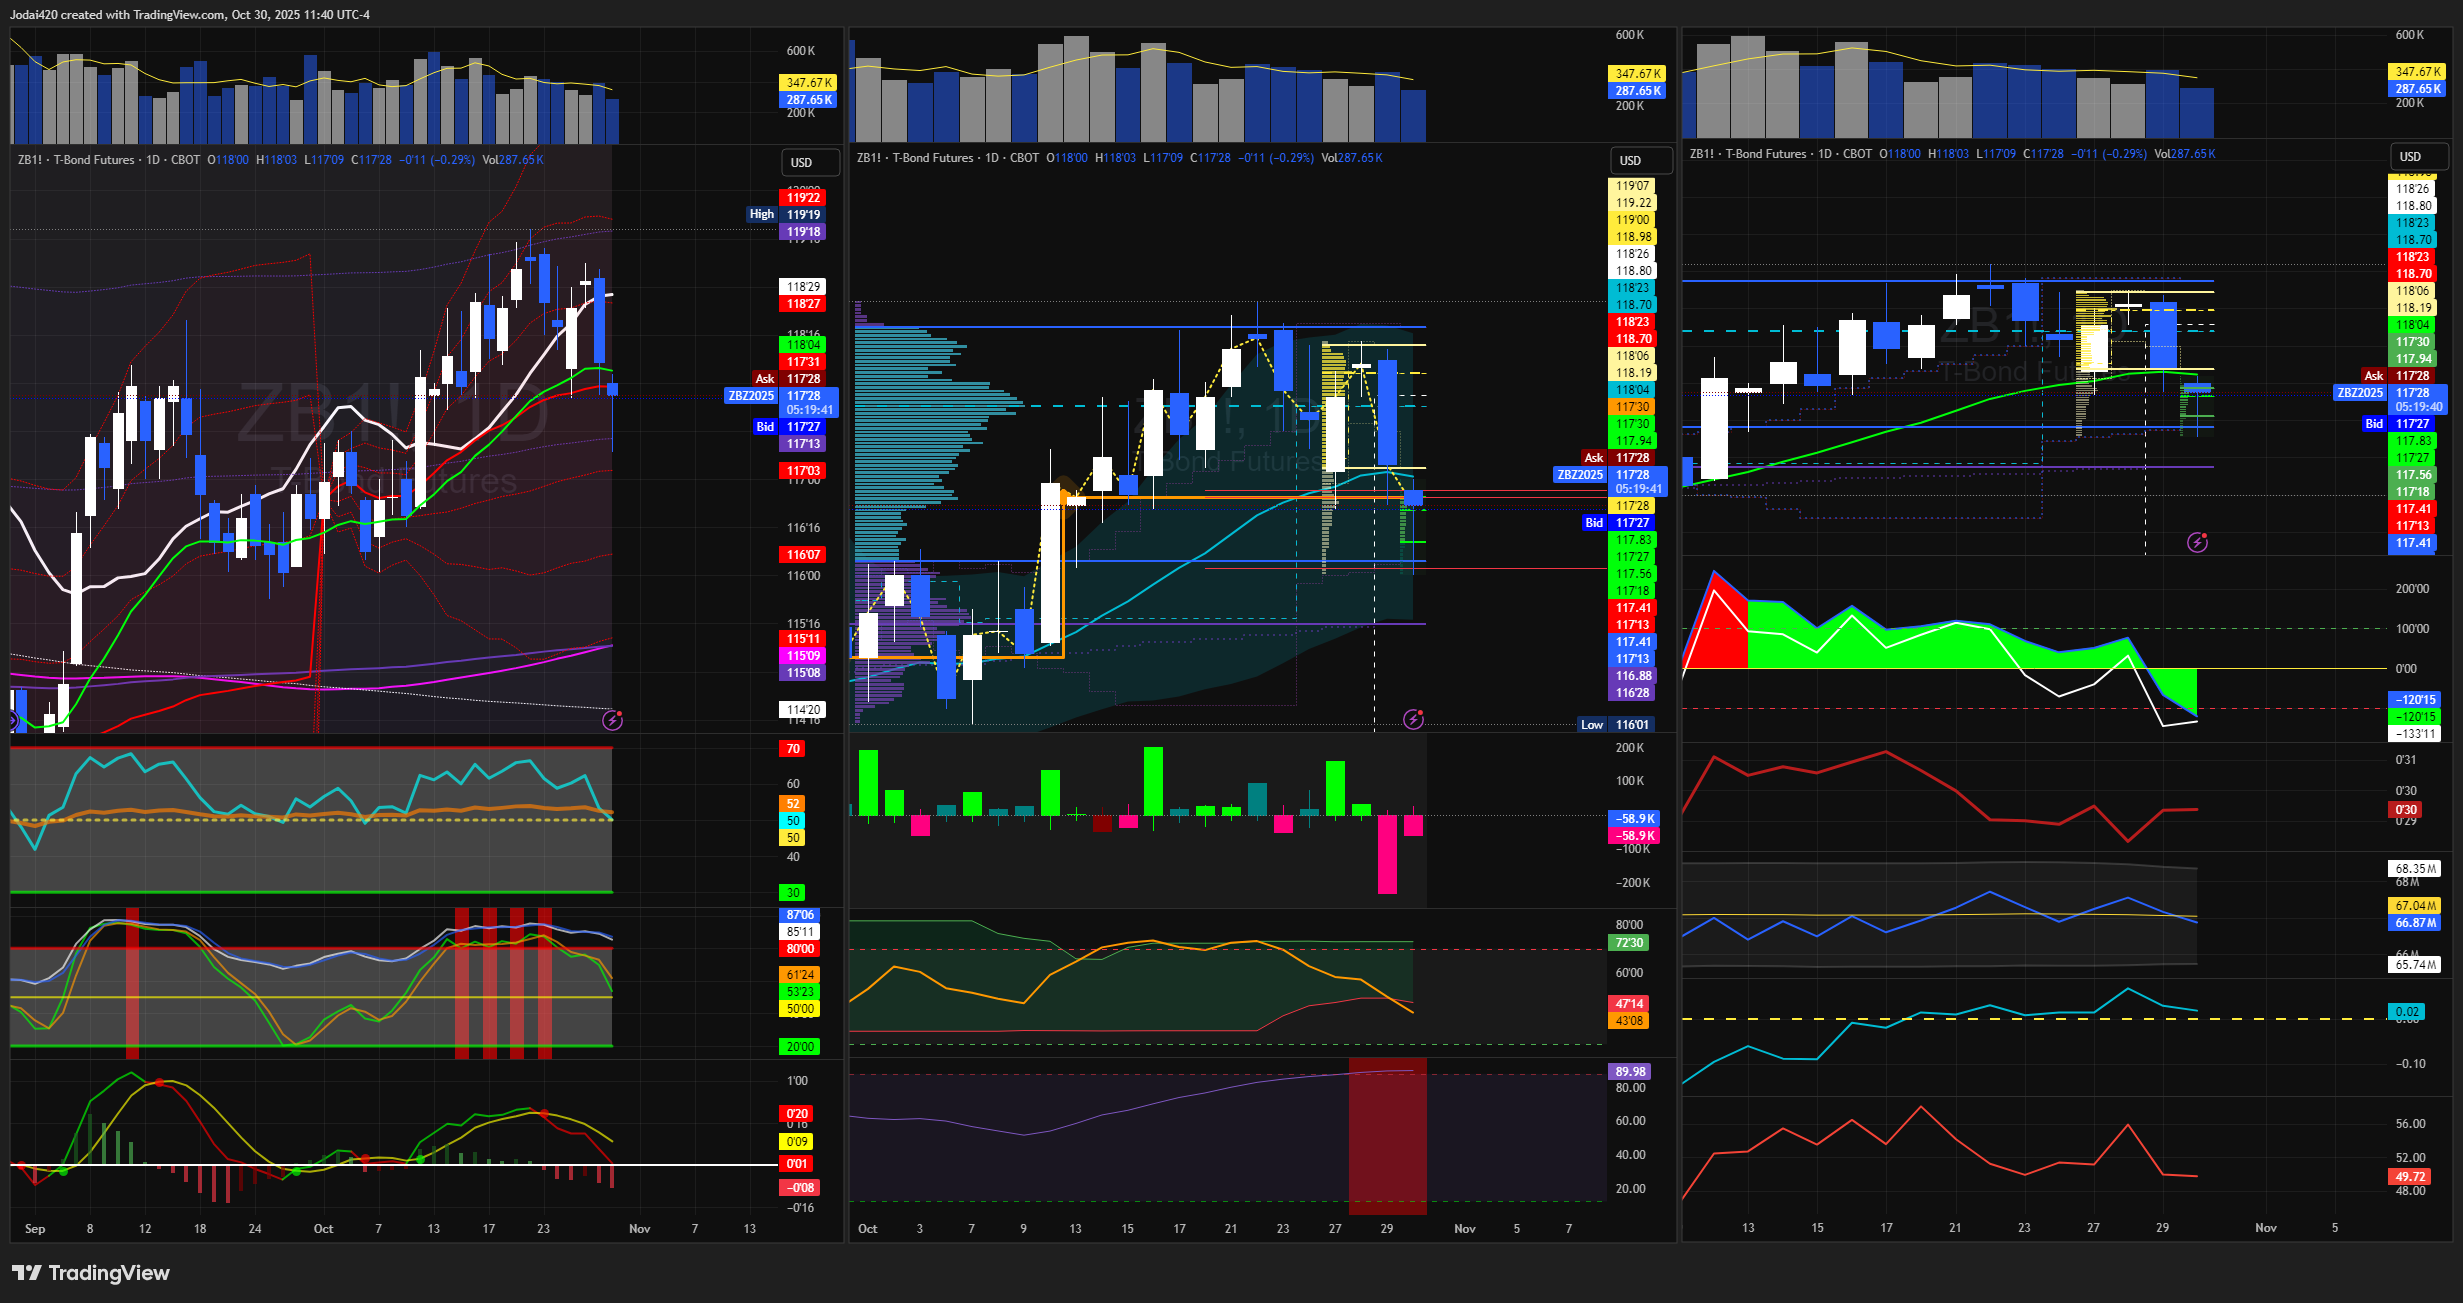
Long-bond futures (ZB) approximately 117’28 on a down day. Bonds down implies yields up, which is a headwind for growth equities. [Fact/Theory]
Cross-Asset / Comparative Context
Posture mapping
Risk-on when Dollar Index is flat or lower and VINMO is stable below 18, or when ZB stabilizes higher. Favor long continuation above 26,018.75. [Theory]
Neutral when Dollar Index is firming but below 100.20 and VINMO sits 16–18. Favor two-way trading inside 26,018.75 and 25,955. [Theory]
Risk-off when Dollar Index pushes into 100.20–100.60 or VINMO exceeds 18 while ZB is red. Favor short setups below 25,955 and fade failed rallies into 26,065–26,105. [Theory]
Risk Management and What Invalidates This
Sizing: for an hourly ATR of 80 points and a one-thousand-dollar risk budget, a 0.40 times ATR stop equals 32 points or 640 dollars per E-mini. That supports one E-mini or fifteen Micro contracts. For a 0.55 times ATR stop equals 44 points or 880 dollars per E-mini. That supports one E-mini or eleven Micro contracts. [Fact]
Throttle rules: trade long only when the Dollar Index is less than 100.00 or flat; reduce size by fifty percent if it rises above 100.20; pause fresh longs if VINMO rises above 18. Upgrade breakout odds by five to ten percentage points if ZB stabilizes green on the one-day chart. [Theory]
Hard invalidations: a sustained move above 26,118 or below 25,767.5 that immediately reverses and holds, or a cross-asset flip that contradicts your trade direction. [Theory]
Fact vs Theory Audit
Facts: numeric Nasdaq levels 26,018.75, 25,992.92, 25,954.70, 25,967, 25,962.75, 25,767.5; listed shelves 25,592, 25,341, 25,323, 25,062; E-mini and Micro point values; chart-labeled Dollar Index resistance 100.527; current reads approximately Dollar Index 99.55, VINMO 16.16, ZB 117’28 as shown on your panes.
Theory: probability weights, ATR stop multipliers, cross-asset gates, regime-flip rules, and throttle rules. These are process rules, not guarantees.
Fast change triggers: Dollar Index acceptance 100.20–100.60; VINMO above 18; a clean fifteen-minute acceptance above 26,118 or below 25,955.
Glossary
Trigger: the price where momentum often begins. Here, 26,018.75 on the one-day chart.
Pivot: the center of balance for the day. Here, 25,955.
Guardrail: a trend reference on the four-hour chart used as a last-defense line. Here, about 25,767.5.
VWAP (volume-weighted average price): the average price weighted by traded volume over a time window.
AAVP (auto-anchored volume profile): an automated histogram of traded volume by price, “anchored” to a start date or event.
POC (point of control): the single price in a profile with the most traded volume.
VINMO: your working volatility monitor. Below 18 supports risk; rising above 18 warns of stress.
DXY: the United States Dollar Index. A stronger dollar often pressures risk assets.
ZB: long-bond futures. When ZB is down, yields are up; higher yields usually pressure growth equities.
XAU: gold. A rising gold price can reflect falling real yields and sometimes supports risk-on posture.
ATR (average true range): a volatility measure used to size stops.
EMA (exponential moving average): a moving average that weights recent prices more.
CVD (cumulative volume delta): a running total of aggressive buying versus selling.
Cross-asset signal: a rule that uses non-equity markets like the dollar, bonds, or gold to tilt equity positioning.
Legal Disclaimer
This content is educational. It is not investment advice, an offer, or a solicitation to buy or sell any security or instrument. Trading futures, options, and cryptocurrencies involves significant risk. Most short-term traders lose money. Always do your own research and consult a licensed financial professional. Never risk money you cannot afford to lose.