Long Term BTC Analysis
The presence of large limit buy orders indicates significant institutional backing, which is preventing a sharp decline
Distribution and Double Top Sell Signal (2021-2022)
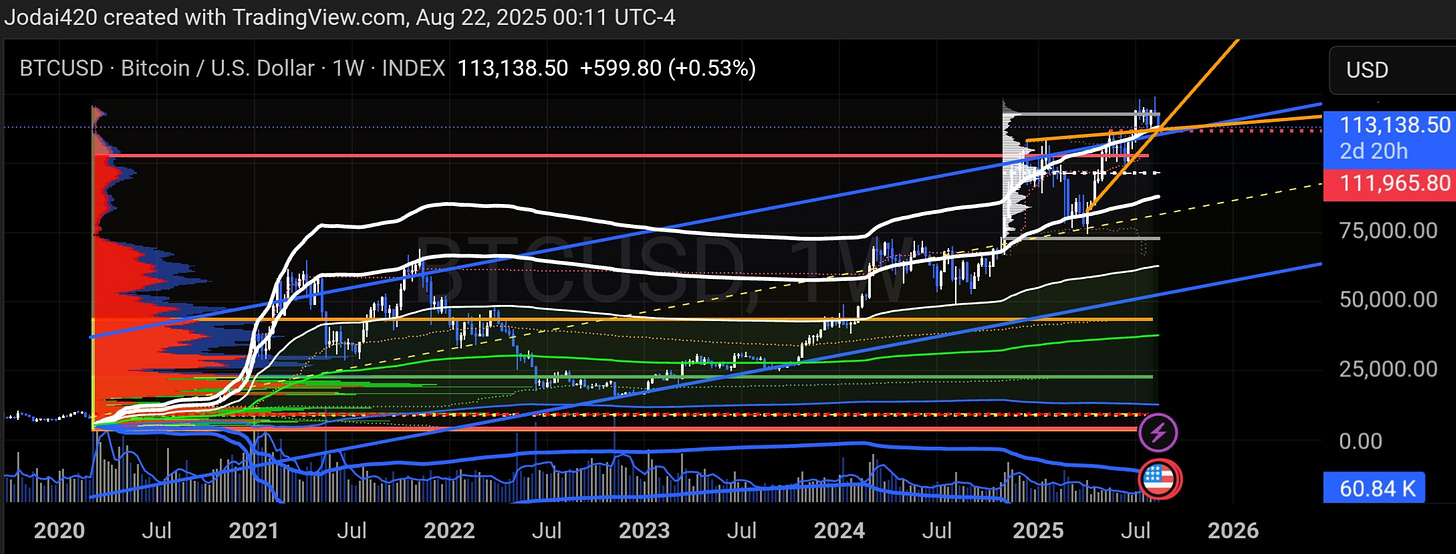
Based on Figure 1.0, BTC's price pushed up to the solid blue slanted line, which represents 1.75 standard deviations (SD) above the dashed yellow regression trendline. This led to a distribution structure, causing the price to fall back to the regression trendline.
A subsequent attempt to break above this channel failed, as the new high was less than a 20% move from the previous one, and proce failed to reclaim the 2nd deviation band of the VWAP, creating a strong double top signal for a short position. The price then collapsed back to the regression trendline, and eventually fell below the white line, which is 1 SD above the Volume-Weighted Average Price (VWAP). The VWAP then acted as a magnet, drawing the price toward it. This period, where buying pressure disappeared, is referred to as a selling vacuum.
Accumulation and Institutional Involvement (2022-2023)
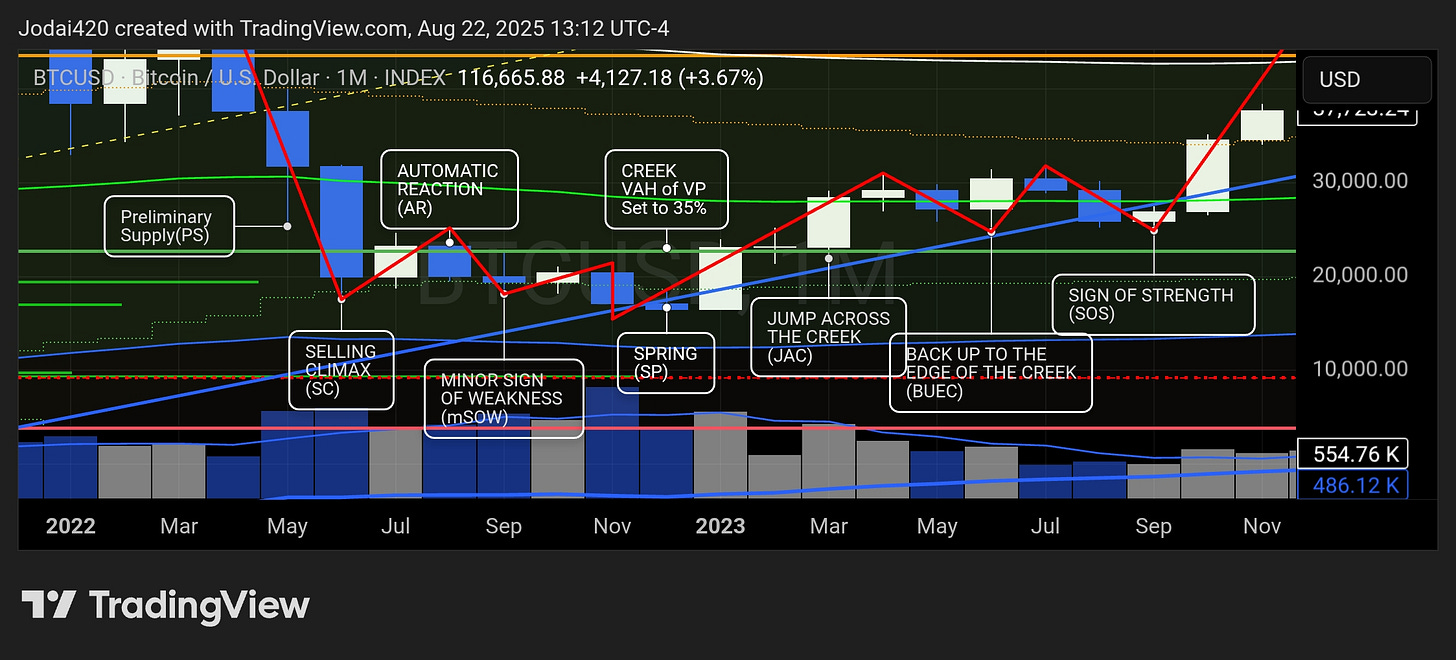
Figure 2.0 shows that multiple "black swan" events caused BTC to fall below both the VWAP and the Value Area High (VAH). After a nearly year-long bear market, an accumulation structure emerged as institutional players and whales absorbed sell orders. This is indicated by candles with small ranges or large lower wicks on high volume, which signal absorption.
The price dropped just below the solid blue diagonal line (1.75 SD) before finding support at the 5-year Point of Control (POC), the dashed red horizontal line. The POC provided the necessary volume for BTC to break back above the VWAP and moving averages. This move initiated a powerful impulse that reached the top of Figure 1.0.
Critical Support and Potential Parabolic Move to close out 2025
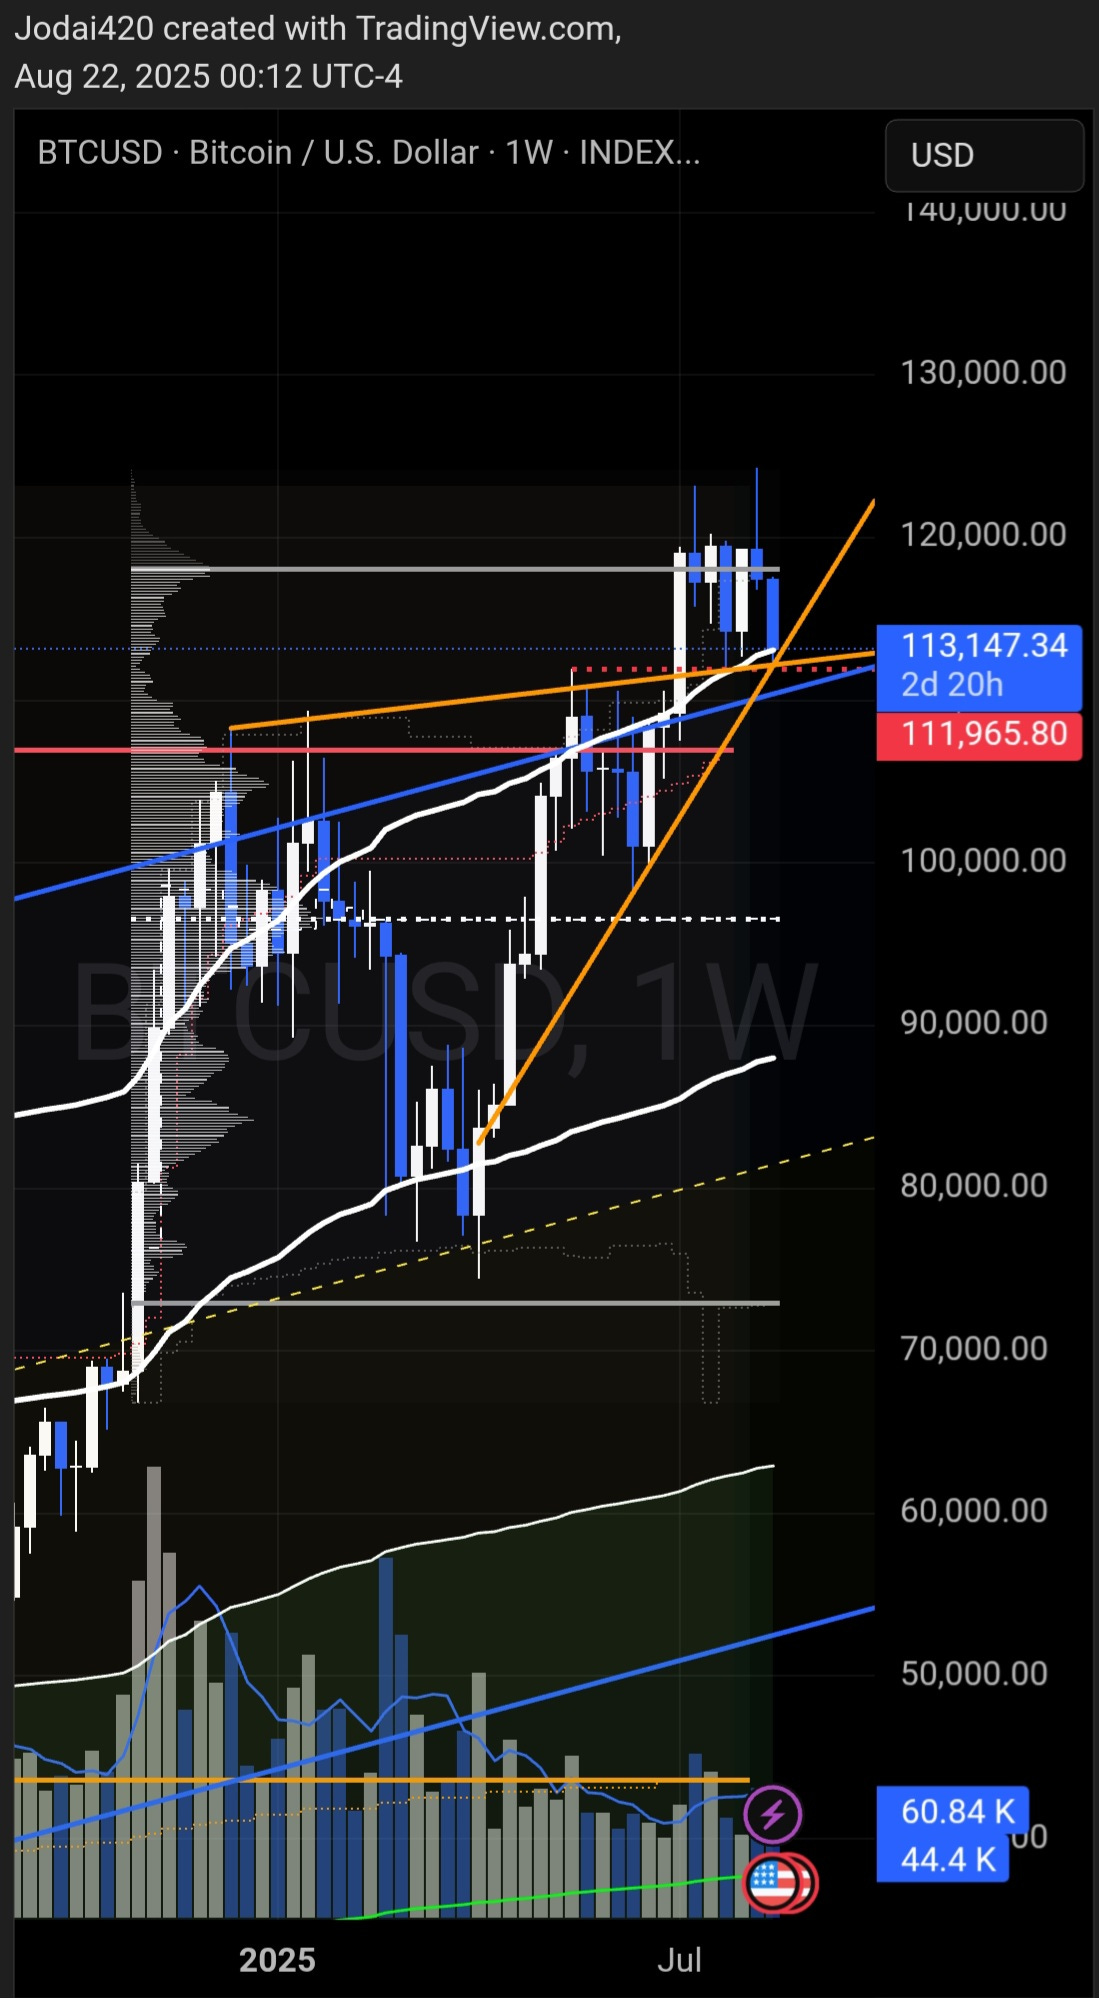
In Figure 3.0, BTC has broken above the solid blue 1.75 SD line. In the past, specifically in 2021 and 2022, moves above this line resulted in a collapse. However, current price action shows that bulls are holding the price above two key support levels:
The 95% Value Area High on the Volume Profile (represented by the solid red line), which is the third standard deviation on a Gaussian bell curve.
The solid white curved line represents the 3rd Standard Deviation of the VWAP. You can see the st and second VWAP standard deviations.
This confluence of support levels suggests a stronger foundation. The presence of large limit buy orders indicates significant institutional backing, which is preventing a sharp decline.
Measured Move of the Bull Flag 2025
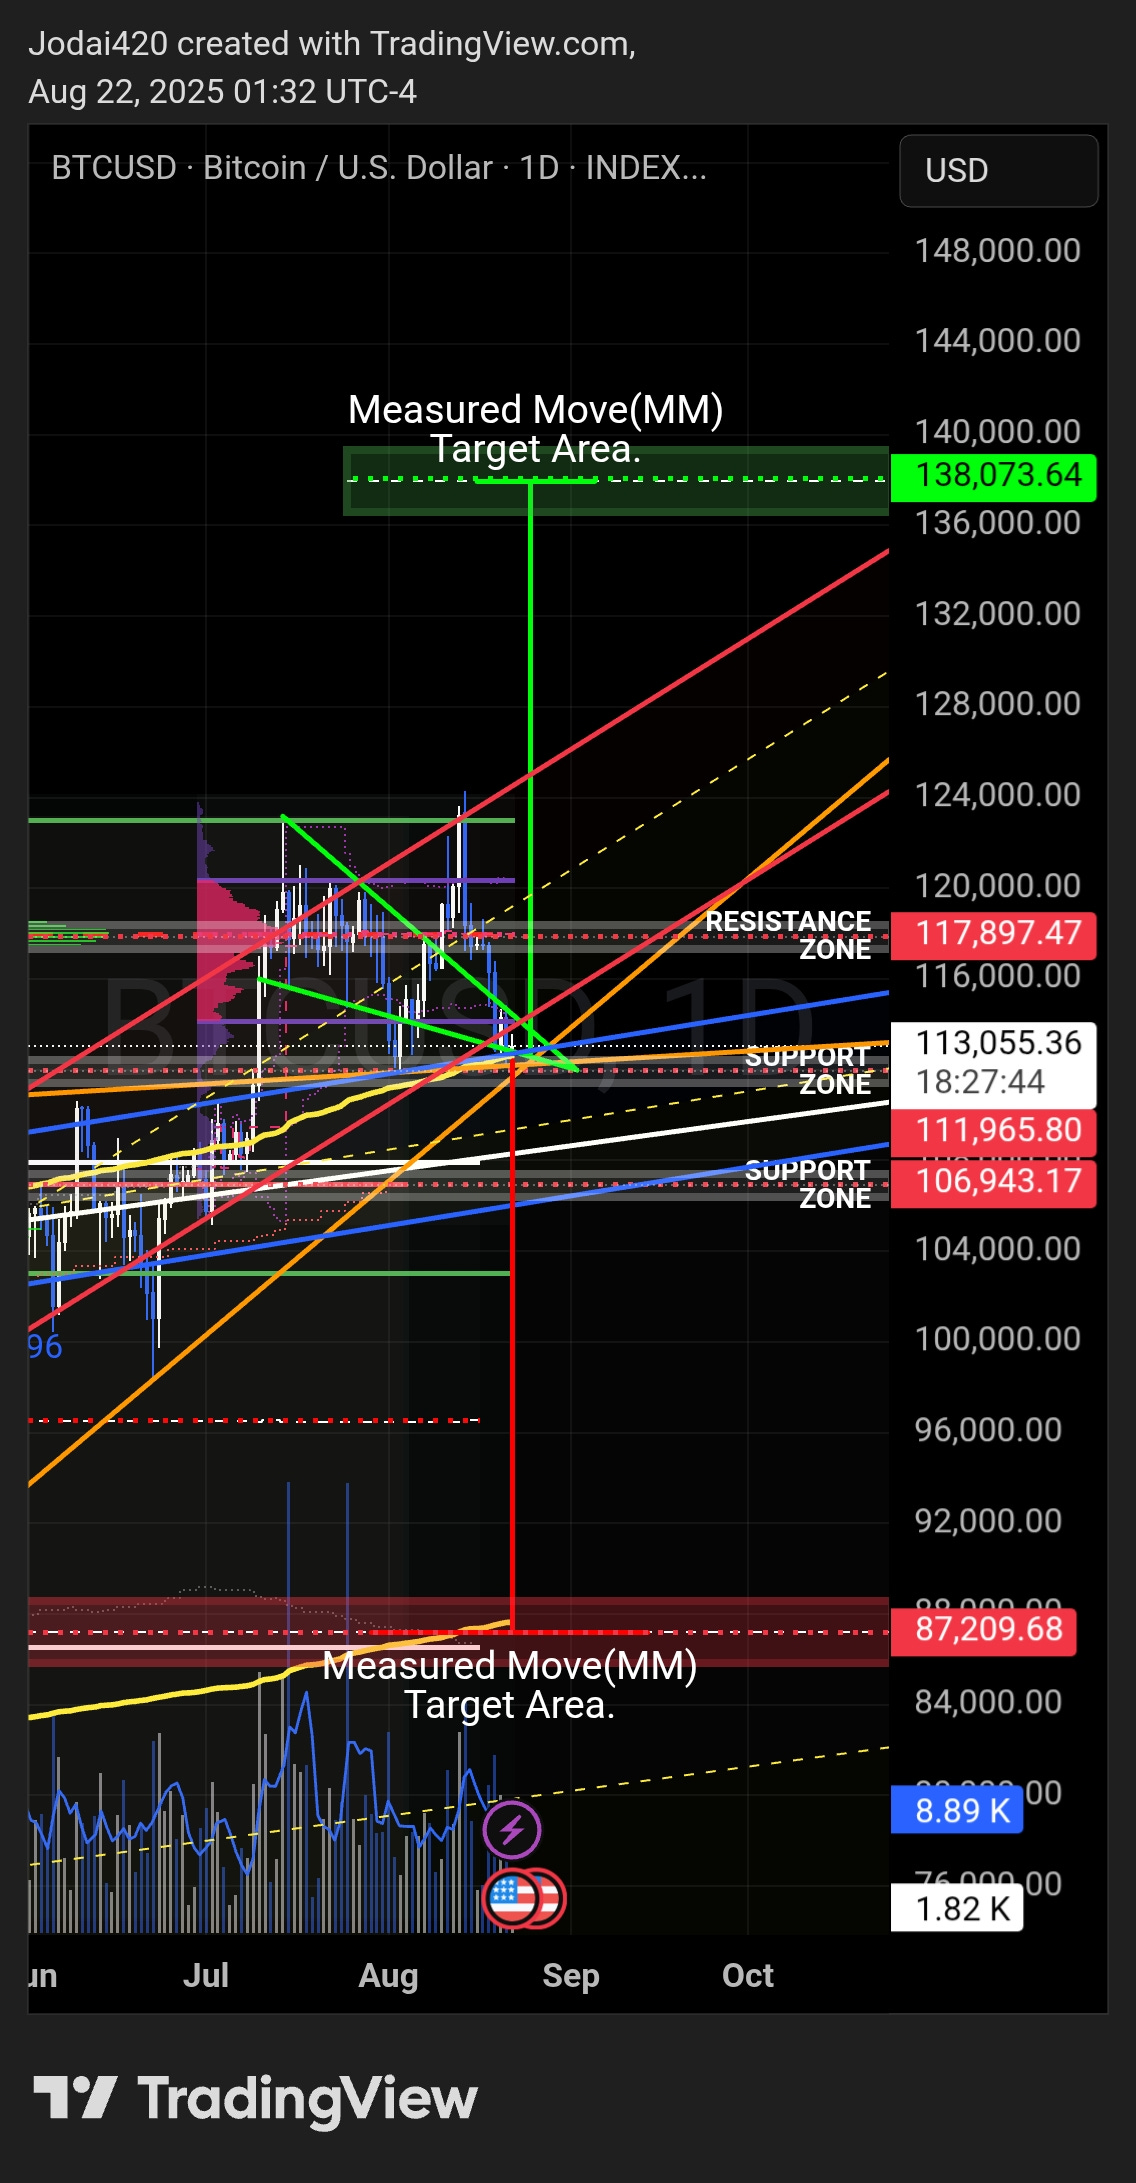
In neon Green we can see that we have a textbook Bull Flag, this one some people call a pennant or triangle, but we trade them exactly the same. And a measured move up and out of a bullflag is typically the height of the channel. A measured move can also be considered from the start of the previous leg up, until the buying climax of the current market structure. I chose to use the previous leg up as my measured move target in my analysis because the Bearish version landed exactly on the 3rd Standard Deviation above the VWAP as a solid yellow squiggly line.
Bullish Scenario:
In Figure 3.0, we can see that BTC transitioned into a much steeper red regression channel, from the shallower blue regression channel. This is normal trend progression, and it signifies strength in a trend, unless the angle becomes greater than 45° when using the standard scale for your chart when you reset the view in TradingView. With this strong breakout, BTC is in a position for a measured move up. If it fails, we will see a measured move down. Traders should watch for a large bull trend Bar to initiate the next leg up on BTC. If the candle is large with low volume, it is a Bull Trap. If BTC reaches the measured move target of $138k and a Bear Trend Bar forms, signals potential profit-taking before another move up.
Bearish Scenario:
I would only consider taking a short trade once we have two downward movements on the 5 year super structure, and we end up at the bottom of the shallower blue regression channel in Figure 3.0 and price rejects off the blue regression channels midline after bouncing off the bottom of the channel, we are moving down to $87, 209.
Conclusion:
In Figure 3.0 as long as BTC stays above the blue regression Channel and we stay in the red regression Channel, as well as above the current support Zone and the purple value area low horizontal line, I see Bitcoin hitting the measured move target above us around $138k. I think that that will be about the top, unless another bull flag forms that turns into a distribution structure.


