

Institutional Bitcoin Forecast — Quantitative Trading System Update (October 20th, 2025)
An evidence-based outlook integrating VWAP, AAVP, and volatility metrics to define BTC’s path into the final quarter.


Table of Contents
Last Week’s Recap
Before diving into this week’s analysis, revisit the prior setup here:
👉 Bitcoin Quantitative Engineering — October 12, 2025
Last week, the Quant Firm projected an accumulation phase between 107k–111k with potential for an upside resolution above 110.7k. That thesis largely held — BTC consolidated within the projected range, validating the model’s probability curve while maintaining a macro bullish regime.
The transition now centers on whether the Point of Control (POC) at 109.8k–110.7k becomes a springboard or ceiling for the next move.
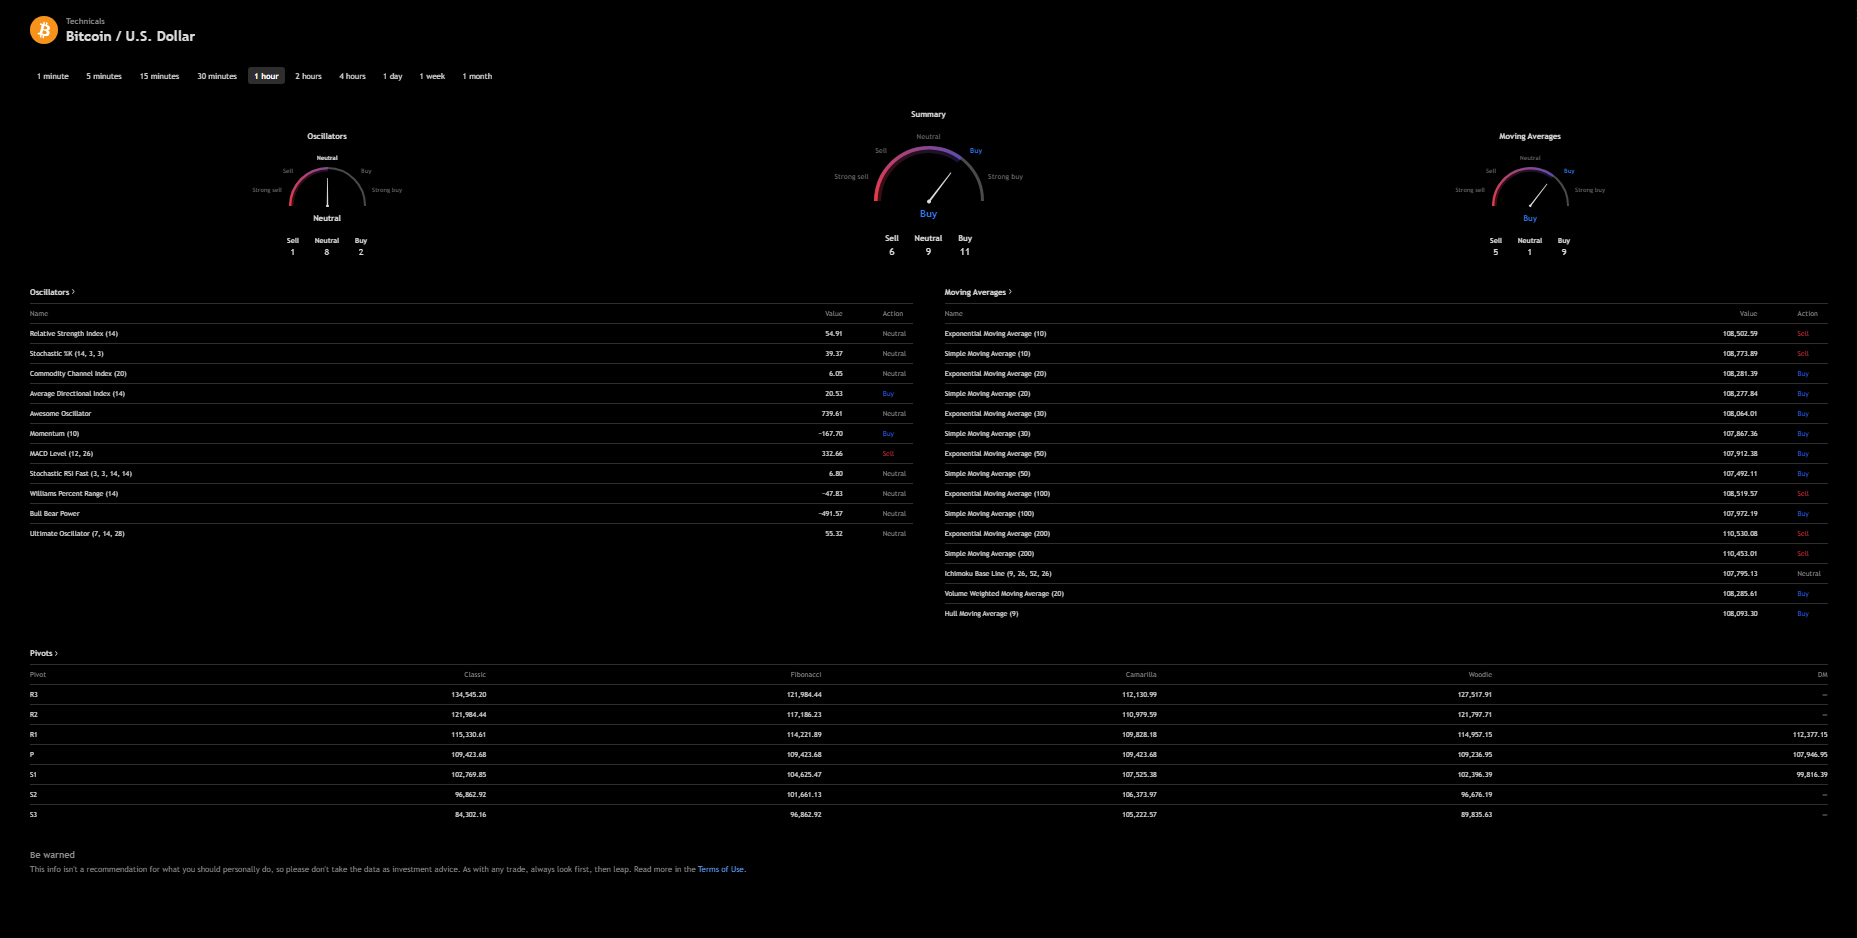
Market Regime Summary
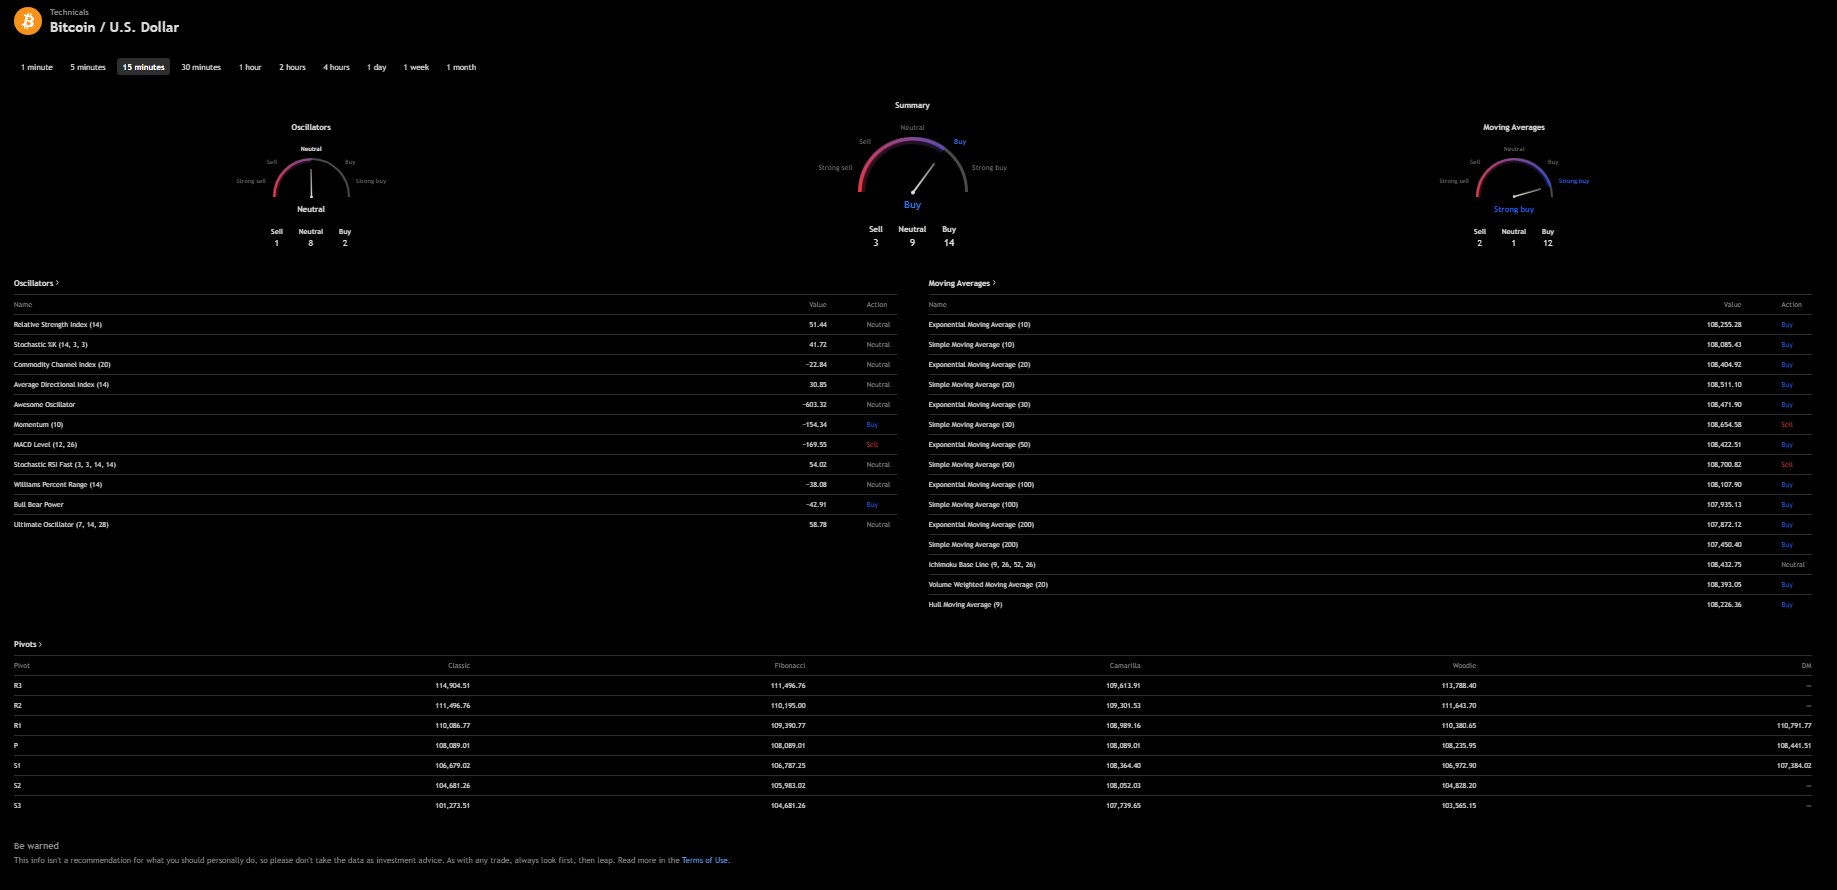
Timeframe Technical Bias Momentum Signal Systemic State 15m Strong Buy Bullish crossover, MA alignment positive Early intraday expansion 30m Buy RSI > 50, Stochastic rising Continuation bias 1h Buy Short-term MAs crossed positive Recovery attempt 4h Sell Momentum still negative Transitional 1D Sell 20/50 MAs down, RSI < 50 Correction phase 1W Buy 21EMA > 50SMA, RSI > 55 Structural bullish base 1M Strong Buy All long-term MAs rising Macro uptrend preserved
🧭 Summary:
BTC remains inside a macro uptrend but with 4h–1D charts locked in correction compression (108k–111k) — a region that must resolve before a sustained breakout.
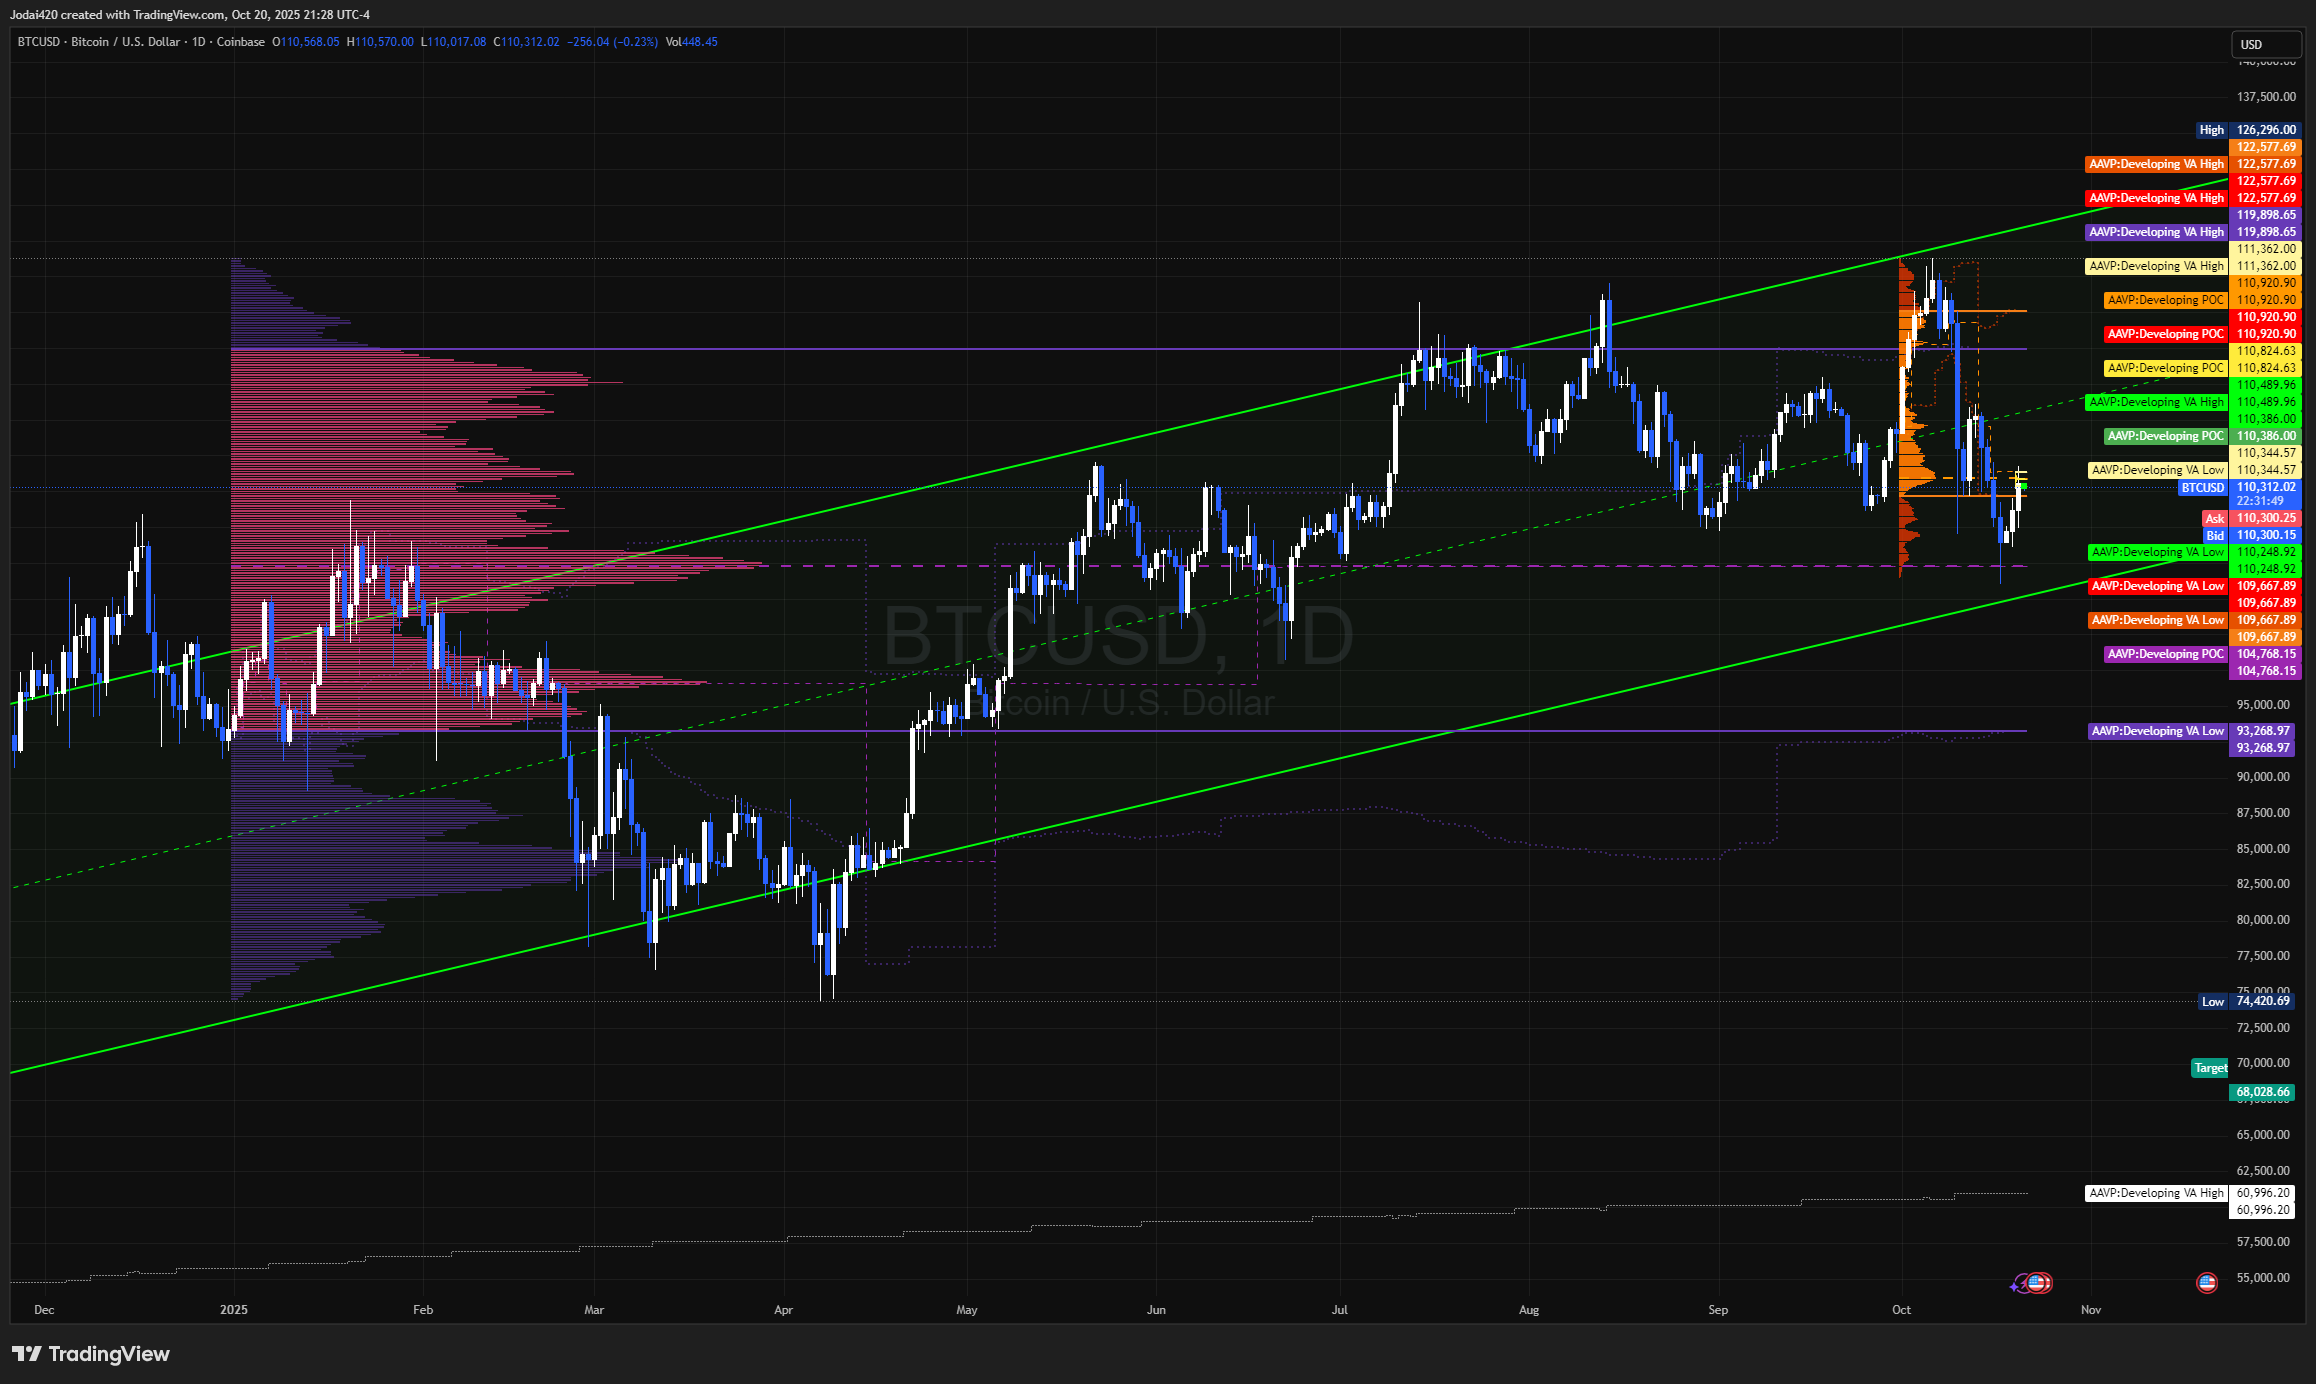
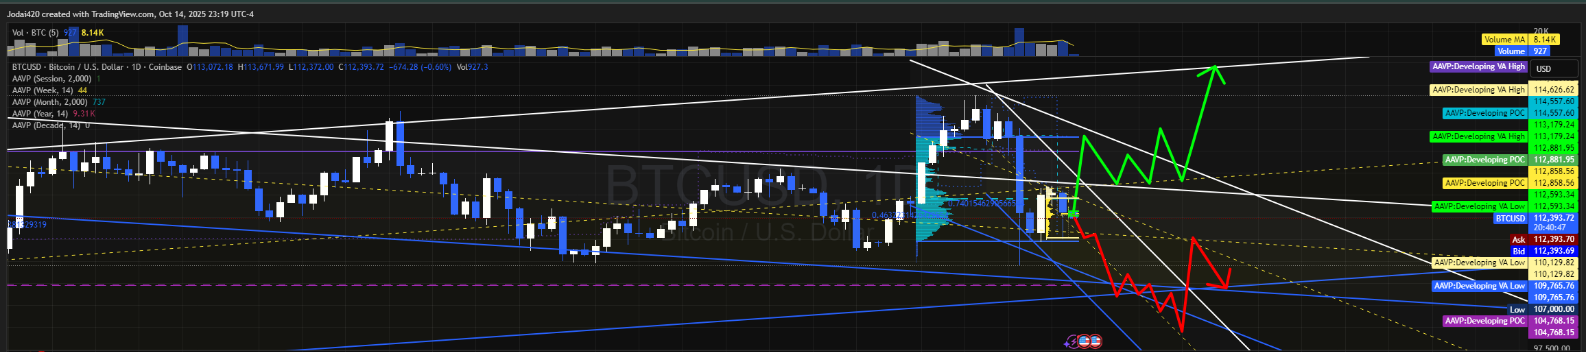
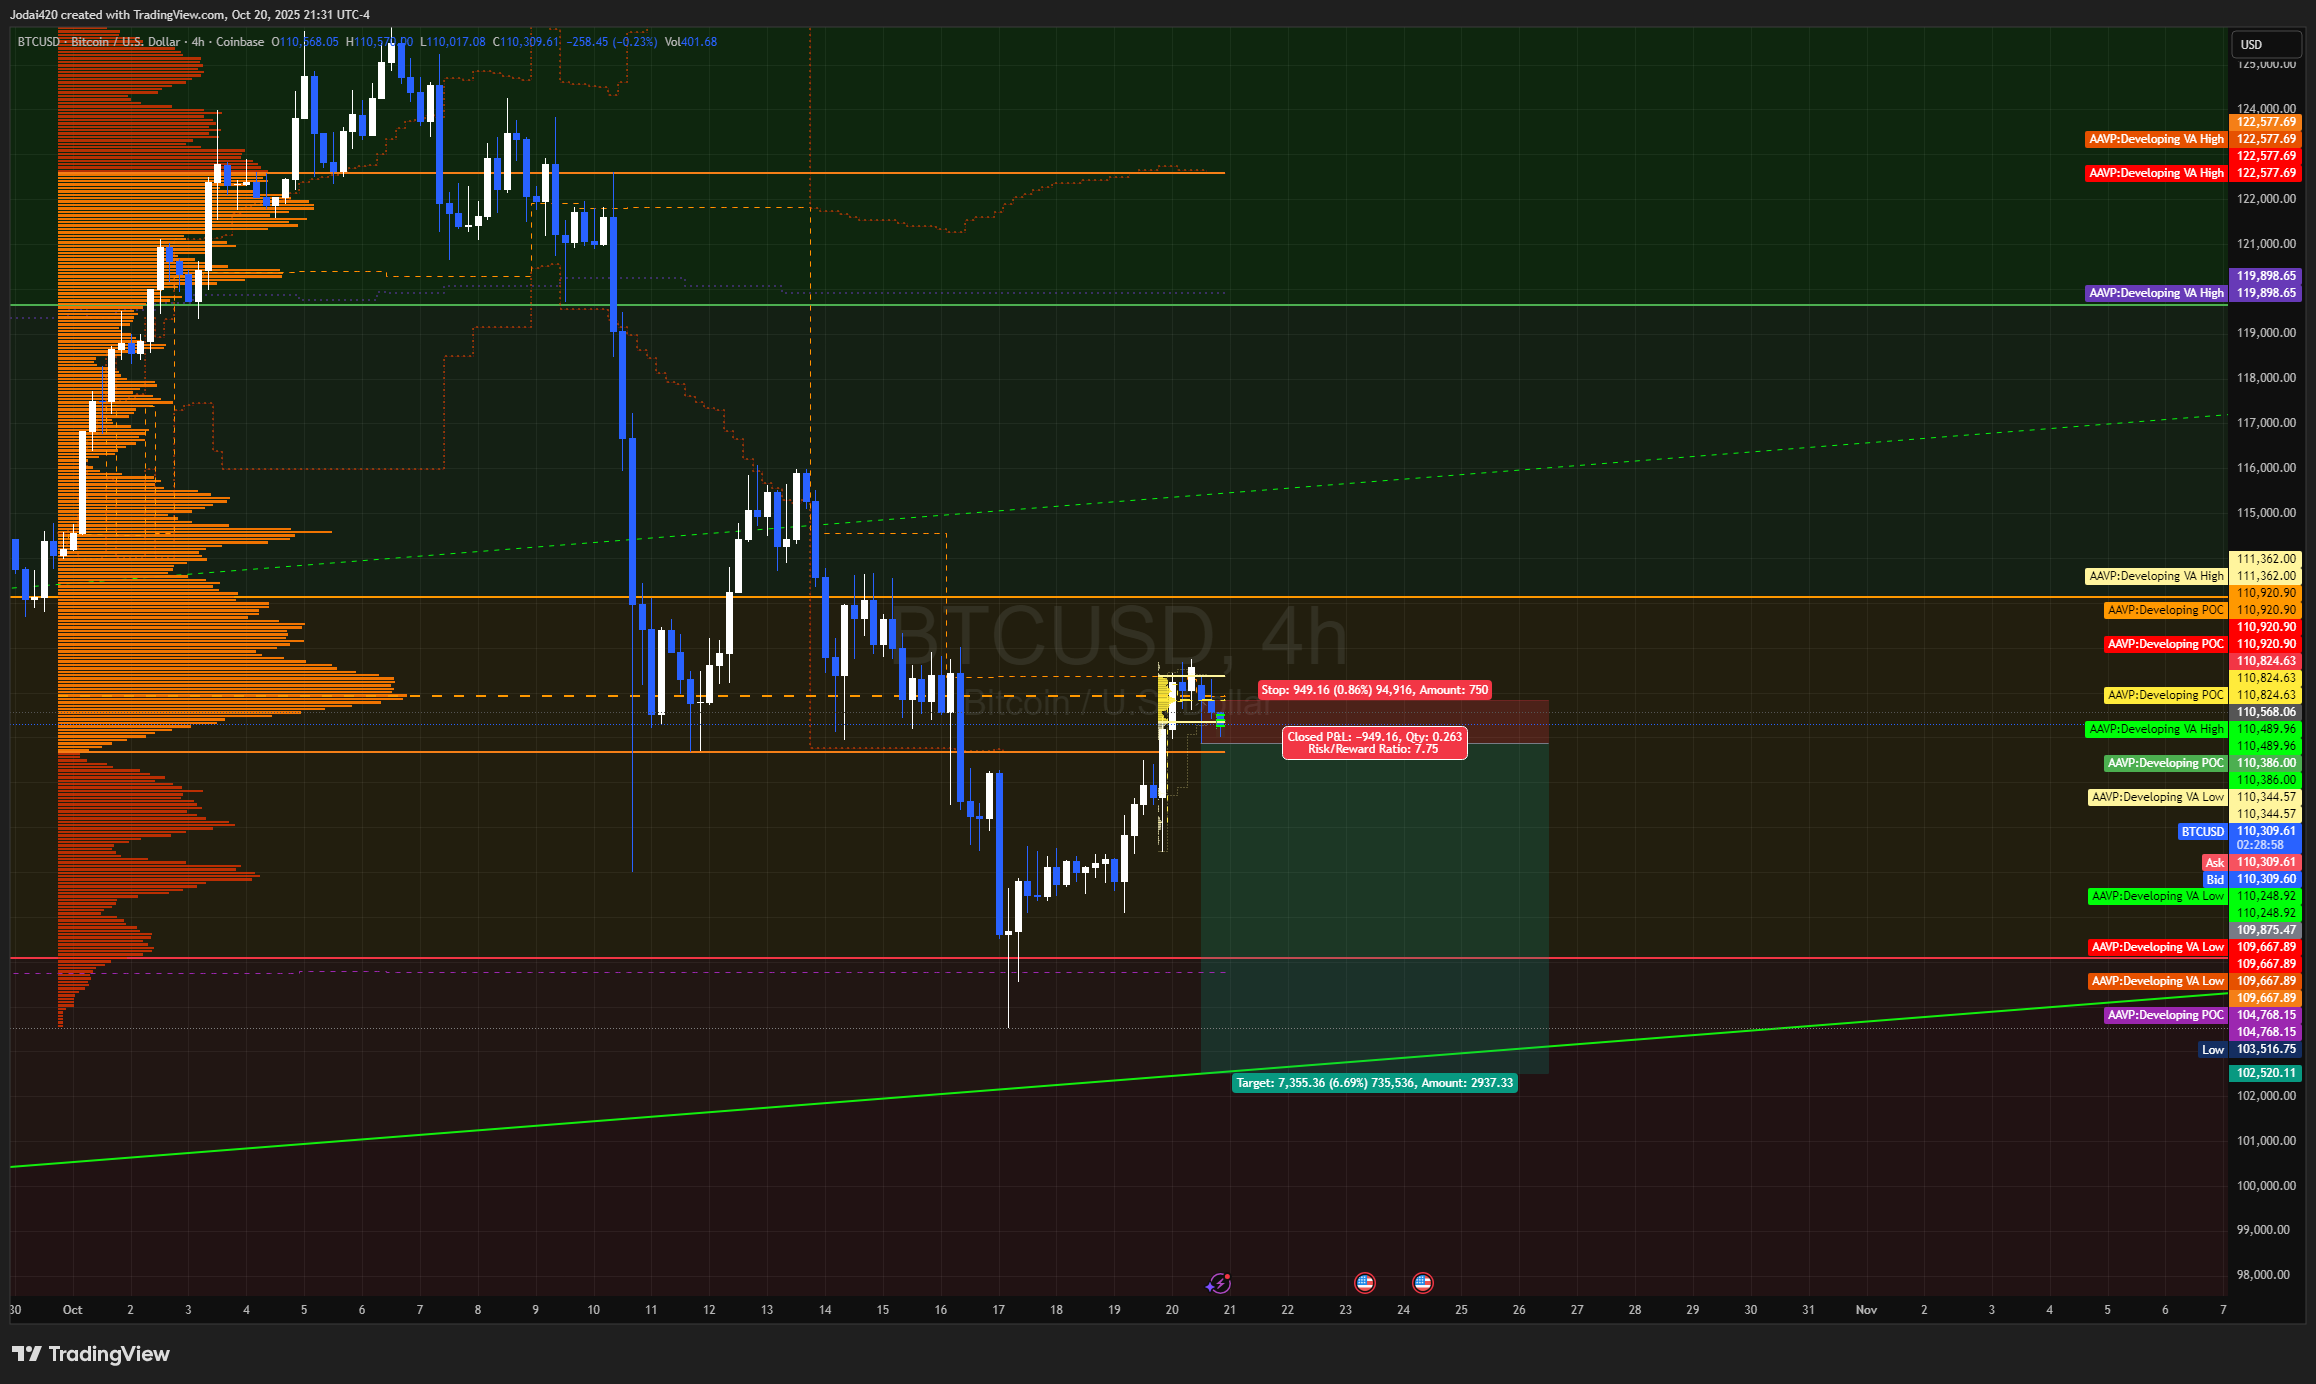
Structural & Volume Profile Analysis
Zone Level Function VAH Cluster 113.4k – 115.6k Resistance ceiling POC Cluster 109.8k – 110.7k Dominant control node VAL Shelf 107.3k – 108.0k Short-term demand floor Secondary Demand 104.5k – 106.3k Deep structural support Macro Support 100.0k – 102.0k Invalidation floor Upside Magnet 117.9k – 121.5k Breakout extension zone
💡 Interpretation:
BTC remains balanced under the POC node (~110k) — consistent with Volume Profile logic where high-volume areas act as consolidation attractors.
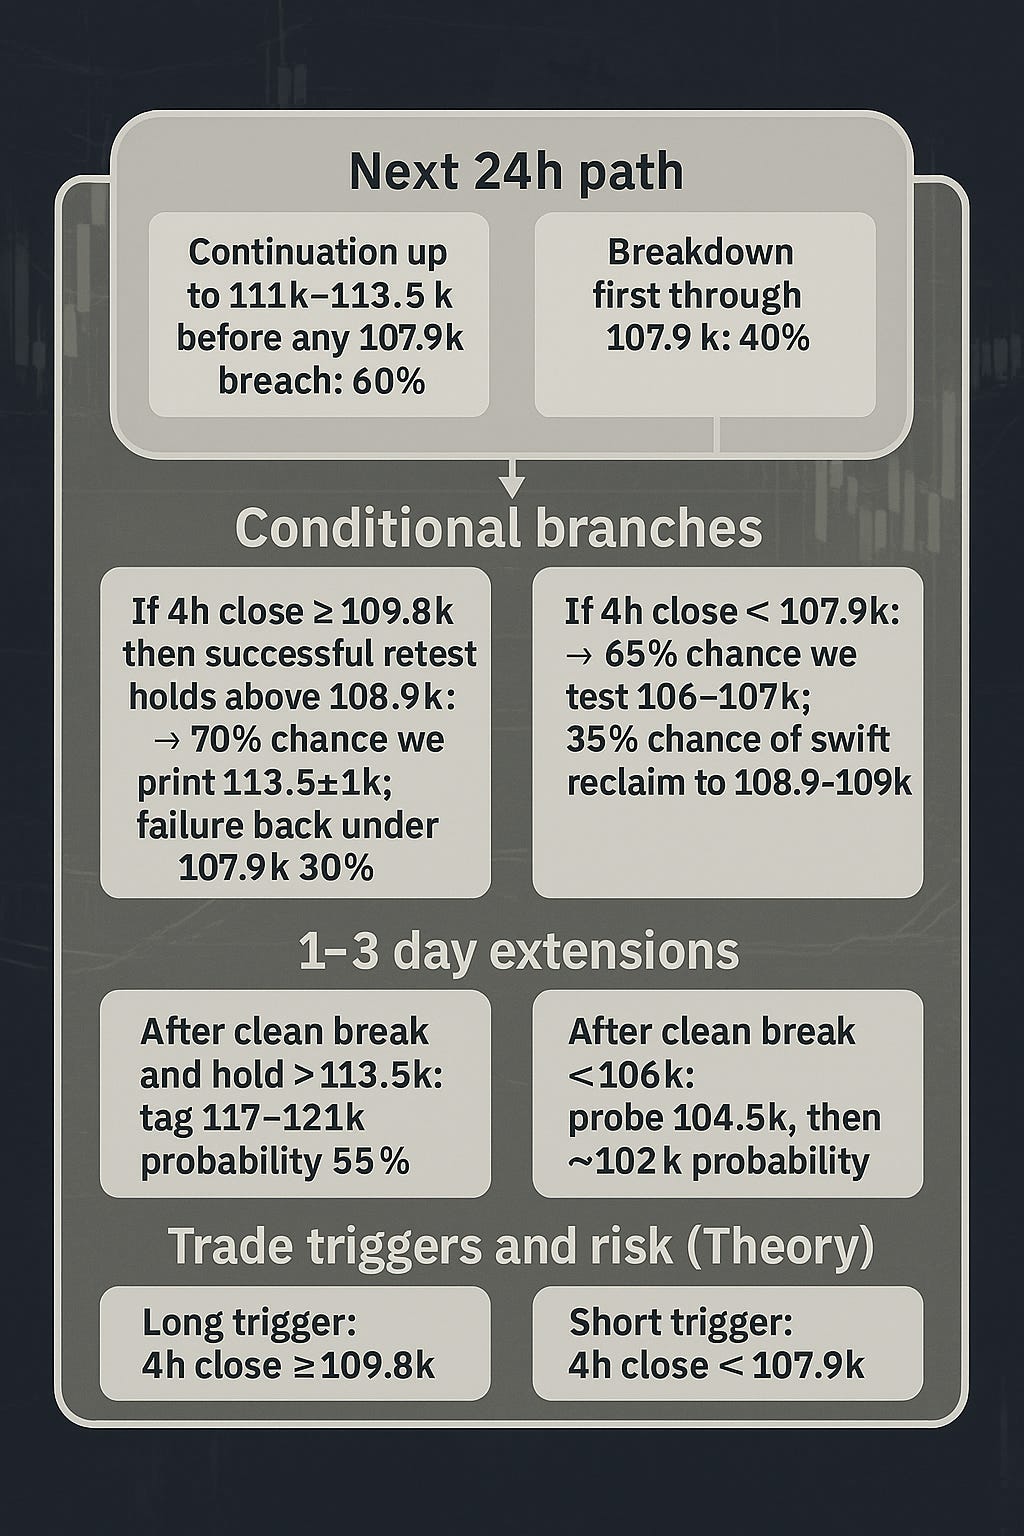
Quant-Firm Probability Matrix
Scenario Description 6h Prob. 24h Prob. Base Range Consolidation 106.5k–113.5k 43 % 41 % Bull Continuation 4h close > 110.7k 27 % 31 % Bear Extension Breakdown < 107.2k 21 % 23 % Full Breakout Acceptance > 115.5k 7 % 5 % Failure Cascade 1D close < 102k 2 % ≤ 3 %
Expected equilibrium: 109.6k ± 2.8k.
Trade Map — Bullish vs Bearish Paths
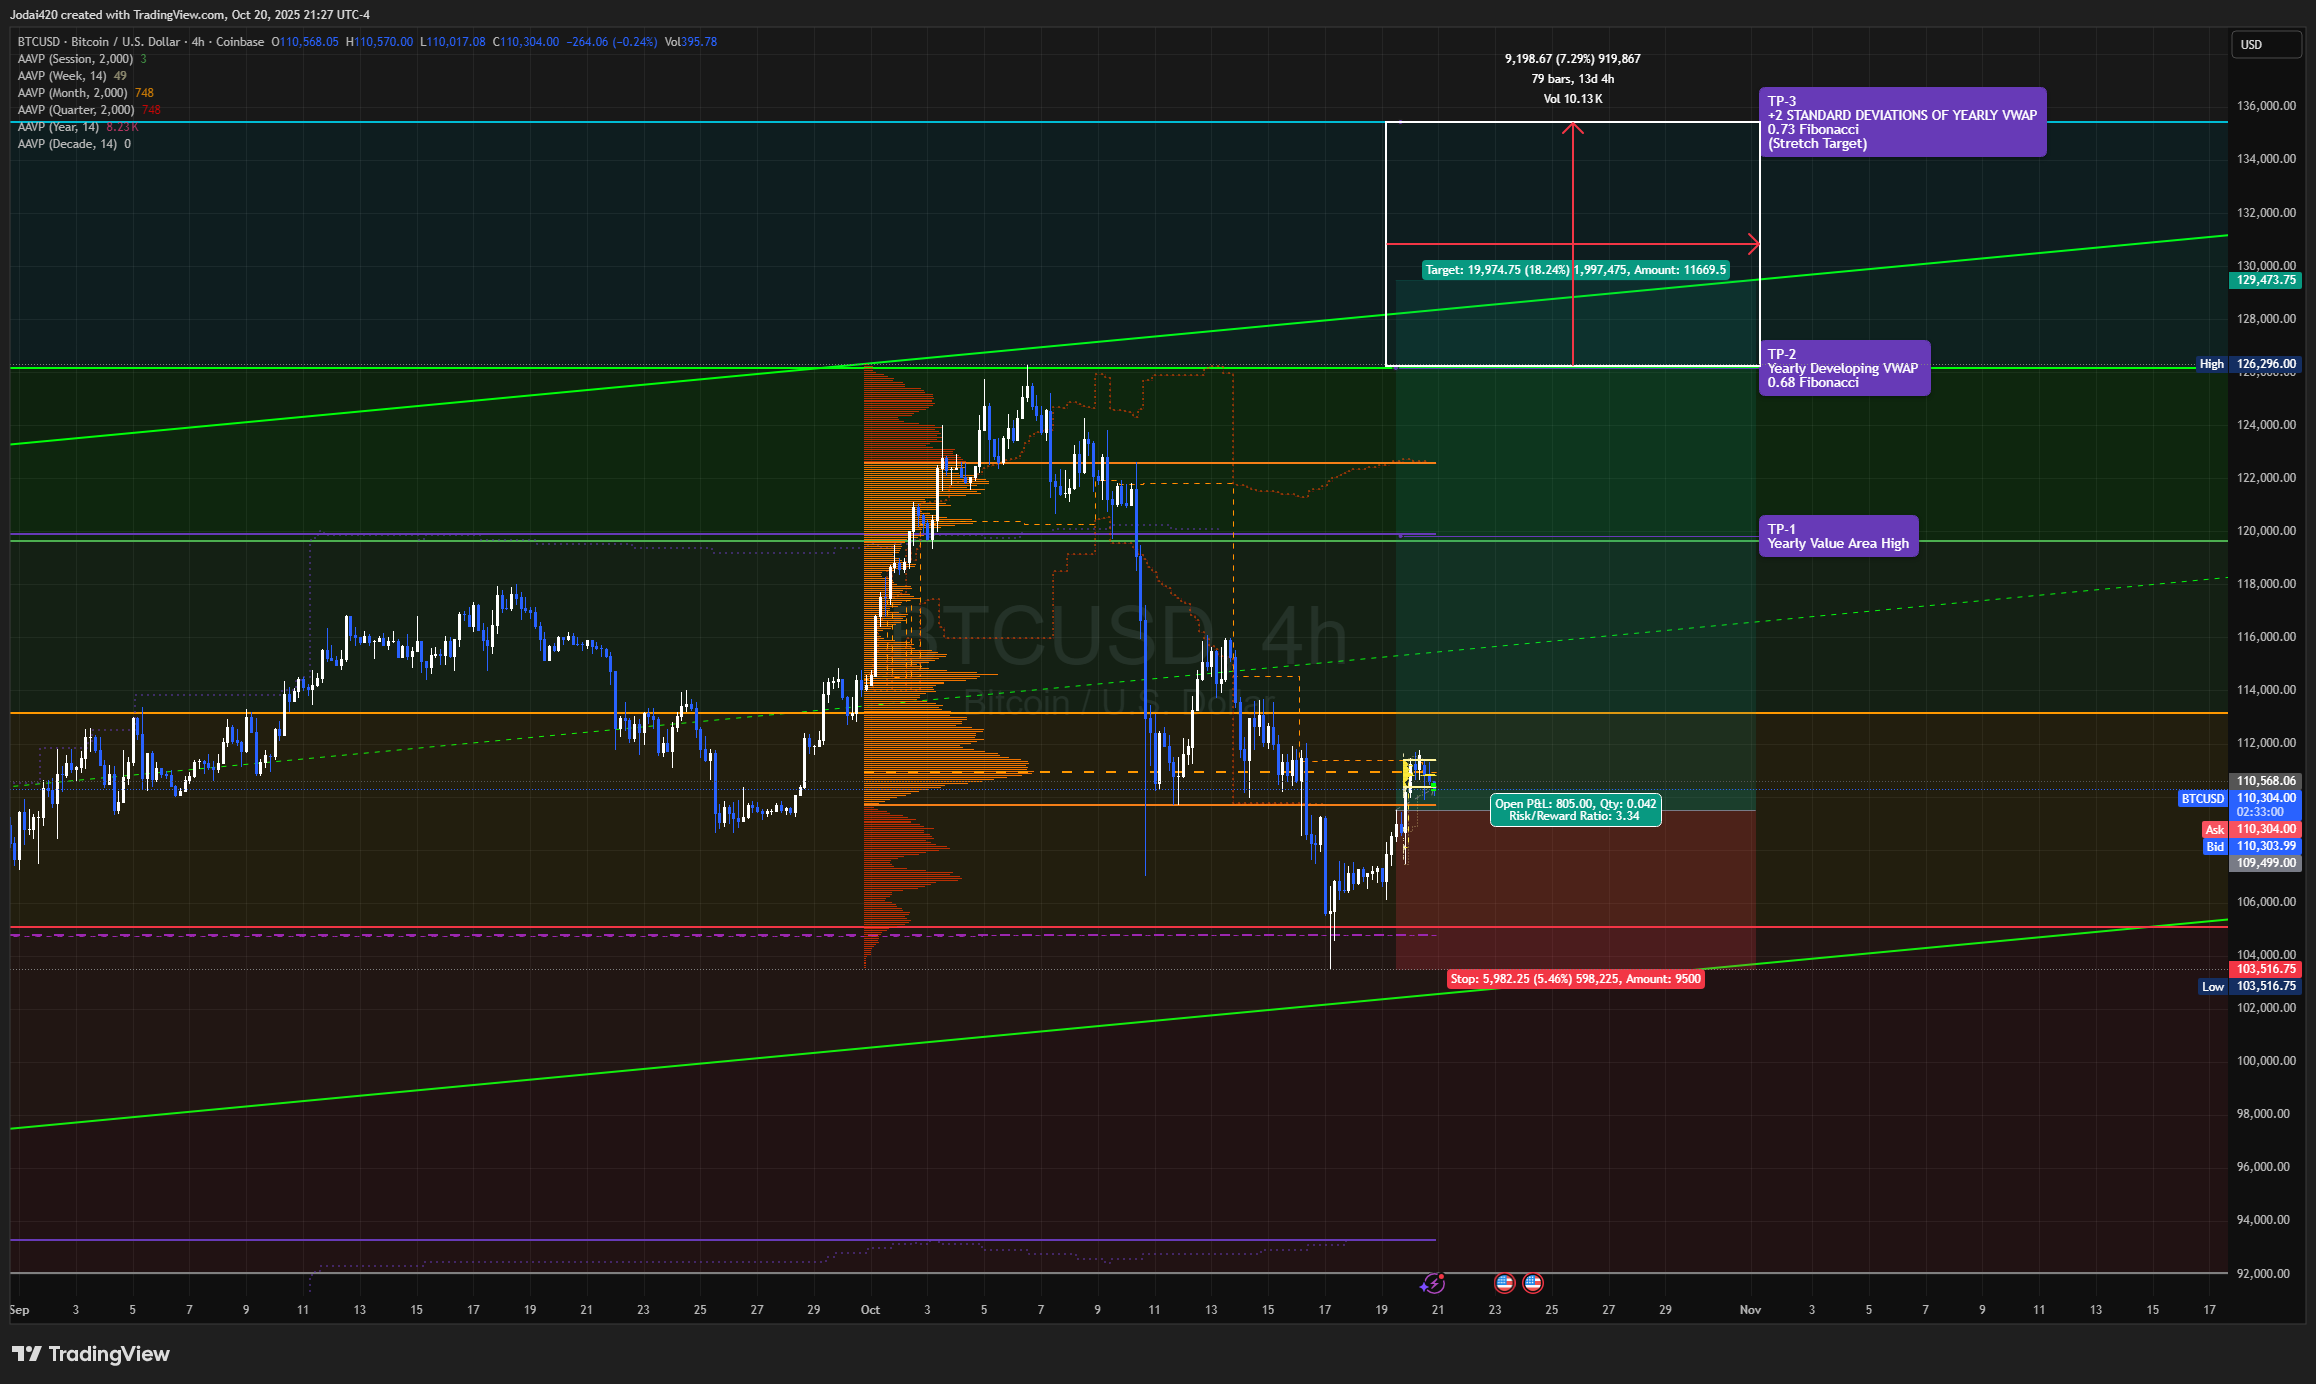
✅ Bullish Path
Trigger: 4h close > 109.8–110.7k
Targets: 113.6k → 115.5k → 117.9k → 121.5k
Invalidation: <107.9k
Confirmation: Daily >115.5k
Bearish Path
Trigger: Rejection 110–111k
Targets: 108.0 → 107.2 → 105.5 → 102k
Invalidation: >110.7k
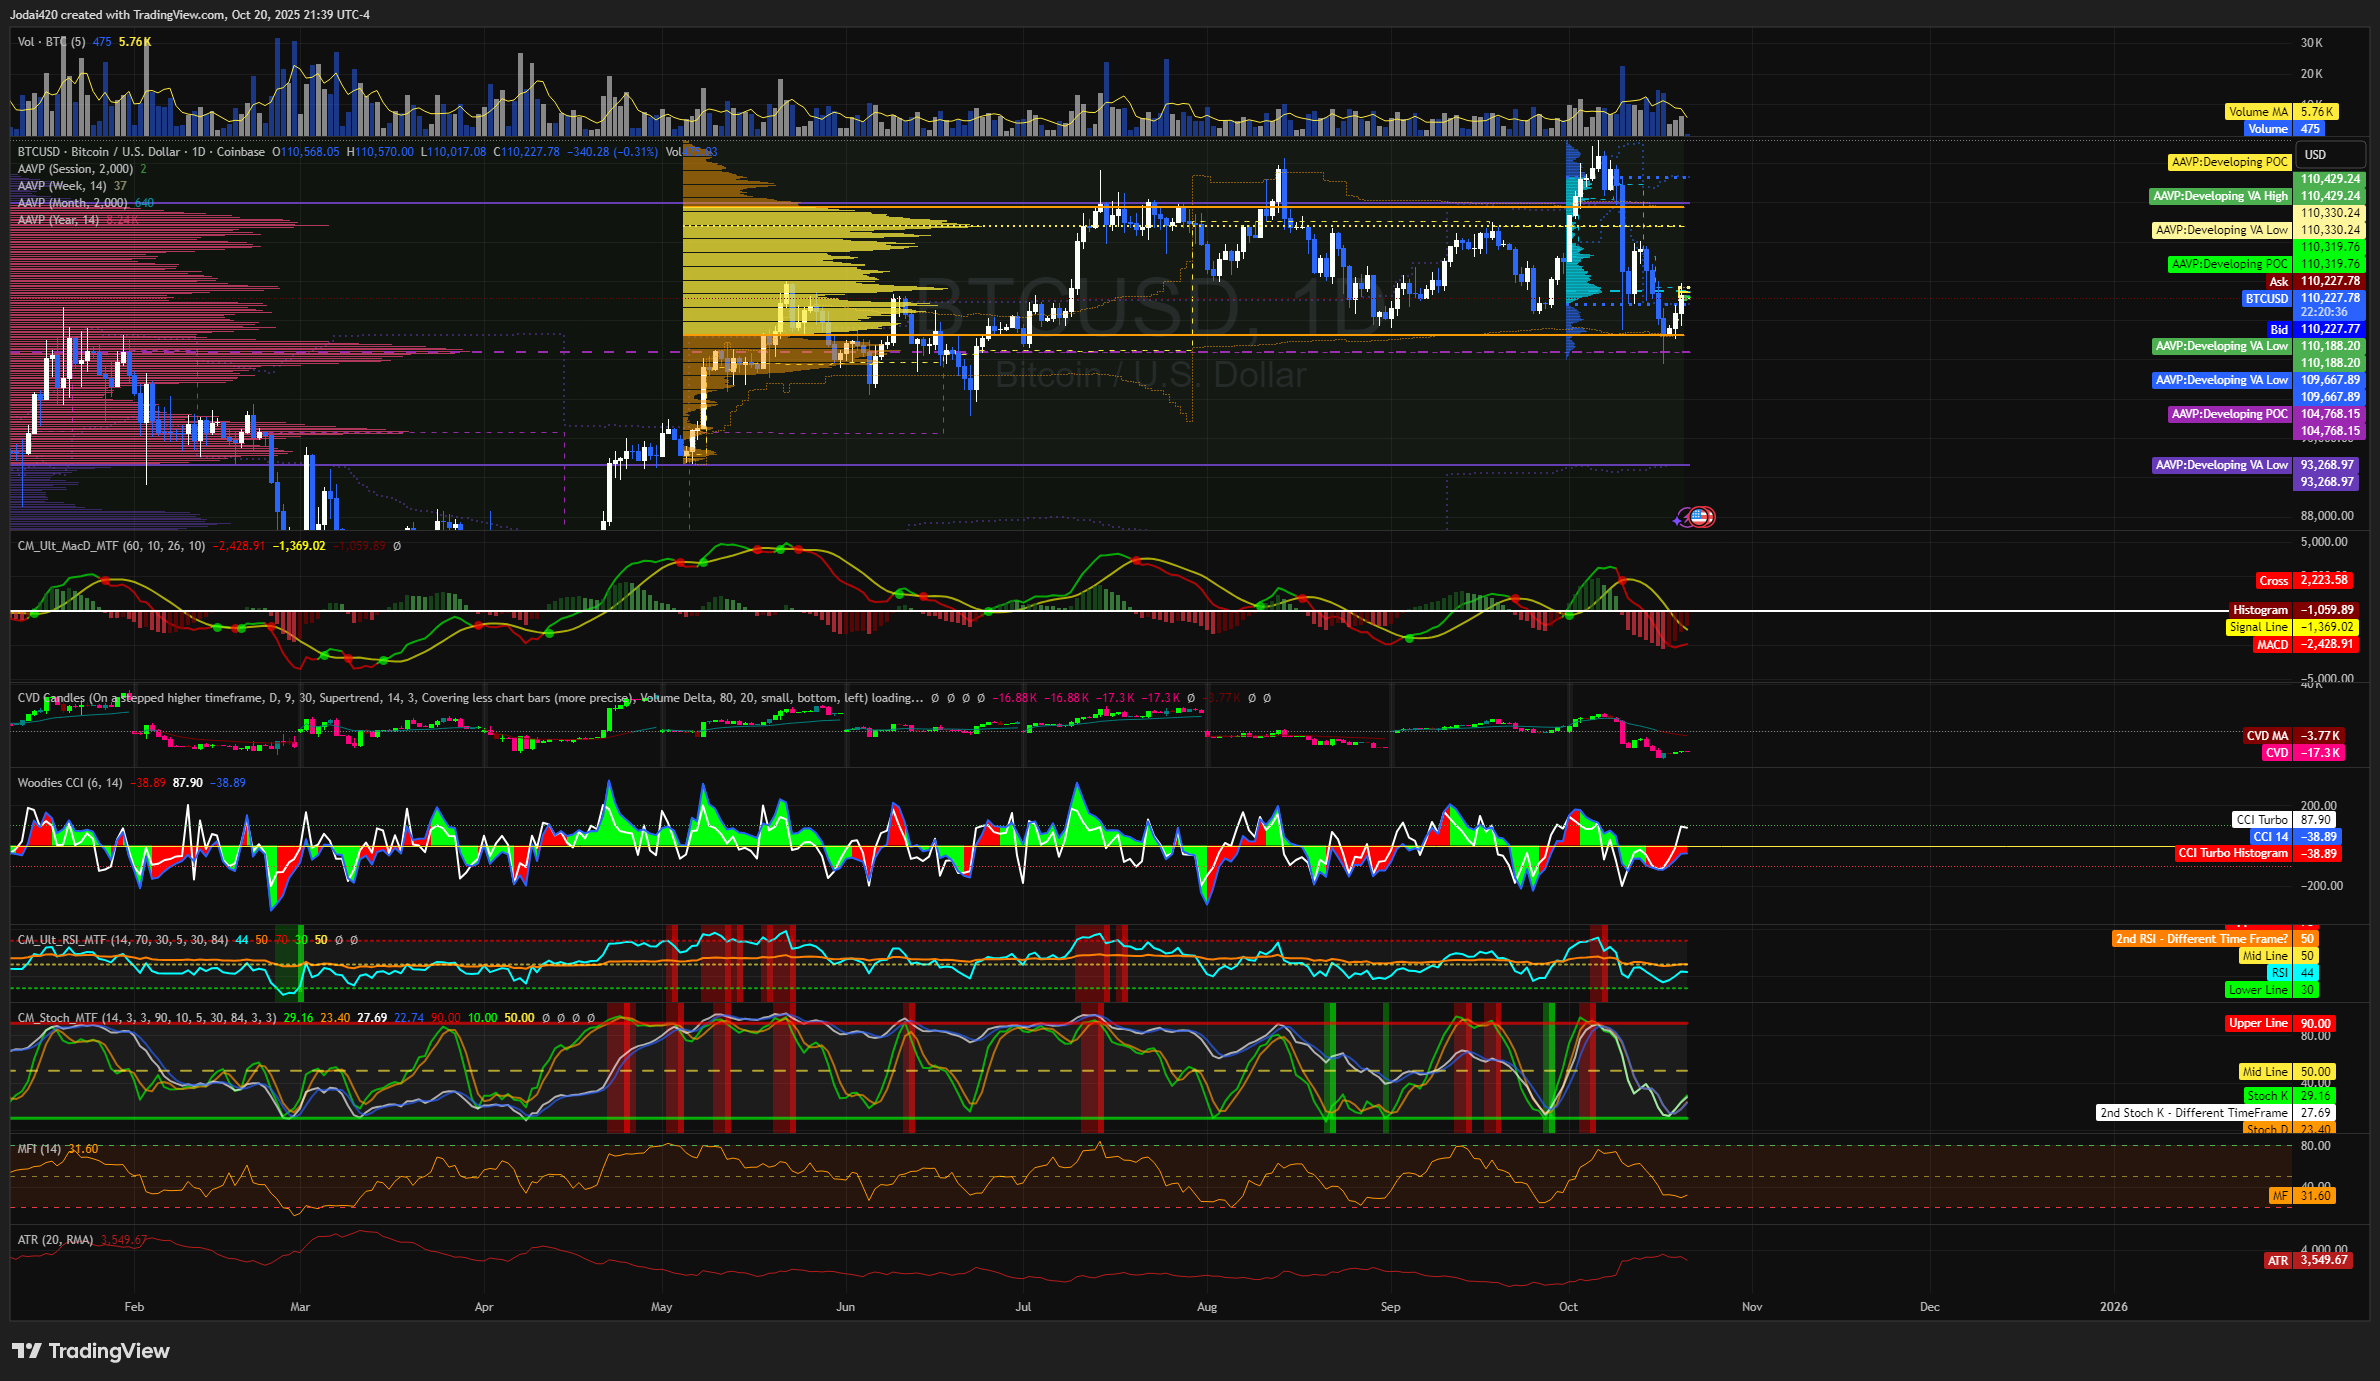
Institutional Risk Map
Metric Observation Interpretation CVD Neutral–positive divergence Accumulation signals OBV Flat Lacking breakout volume MACD (4h) Near crossover Awaiting trigger RSI (1D) 39–45 Neutral–bearish MFI (1D) ~25 Low inflows = upside potential
Interpretation: Momentum is stabilizing but unconfirmed. If BTC reclaims 110k on volume, confirmation wave likely follows.
ATR-Based Position Sizing
Tier Stop Distance Max Exposure Formula Scalp / Intraday 0.8×ATR ≈ 460 pts 3 trades (Equity × 0.5%) / Stop Swing / Tactical 1.2×ATR ≈ 690 pts 2 trades (Equity × 1%) / Stop Structural / Macro 2×ATR ≈ 1150 pts 1 trade (Equity × 1.5%) / Stop
Learn about Average True Range (ATR) and volatility-based sizing.
Structural Triggers for the Week Ahead
Condition Action 4h >110.7k + positive CVD Open tactical long Daily >113.6k Add swing exposure 1D <107.2k Exit longs / open tactical short Weekly <102k Full de-risking
Quantitative Outlook Summary
BTC remains in accumulation under its control node, with asymmetric risk/reward improving toward the upside.
Volatility: compressing, suggesting an imminent directional move.
Directional Bias: mild bullish with mean reversion potential.
Expected drift (24h): +1.1 %
Weekly drift: +3.5 %
Tail risk (<102k): ~3 %
Fact vs Theory Audit
Statement Type Confidence 109.8–110.7k = POC Fact 100 % Buyers absorbing under 108k Theory (CVD-based) 85 % Inverted H&S forming (4h) Theory 80 % 117–121k breakout target Projection 75 %
Quant-Firm Consensus & Final Outlook
6h Bias: Neutral-Bullish
24h Bias: Accumulation-Range
Structural Invalidation: Weekly <102k
Summary Insight:
BTC remains in a macro-bullish, mid-term corrective structure. Probability-weighted expectation favors a range expansion above 110.7k within 24–48 hours. Confirmation requires sustained buy volume and VWAP reclaim.
Glossary
VWAP (Volume-Weighted Average Price) — A measure of average traded price weighted by volume.
TPO (Time Price Opportunity) — Charting method that maps time spent at price.
POC (Point of Control) — Price level with highest traded volume in a session.
RSI (Relative Strength Index) — Momentum oscillator measuring overbought or oversold conditions.
ATR (Average True Range) — Indicator of market volatility.
CVD (Cumulative Volume Delta) — Measures buyer/seller aggression from order flow.
Wyckoff Theory — Framework describing accumulation, markup, distribution, and markdown phases in markets.
Disclaimer
This report is for educational and informational purposes only. It does not constitute financial advice.
Trading cryptocurrencies involves high risk; most traders lose money. Conduct your own research and consult a licensed professional before investing.
