How I Speed Hunt for big breakouts and increased volatility when scalp trading 1m, 3m and 5m charts.
We will go over time management of trades. How to get a manageable number of stocks to chart

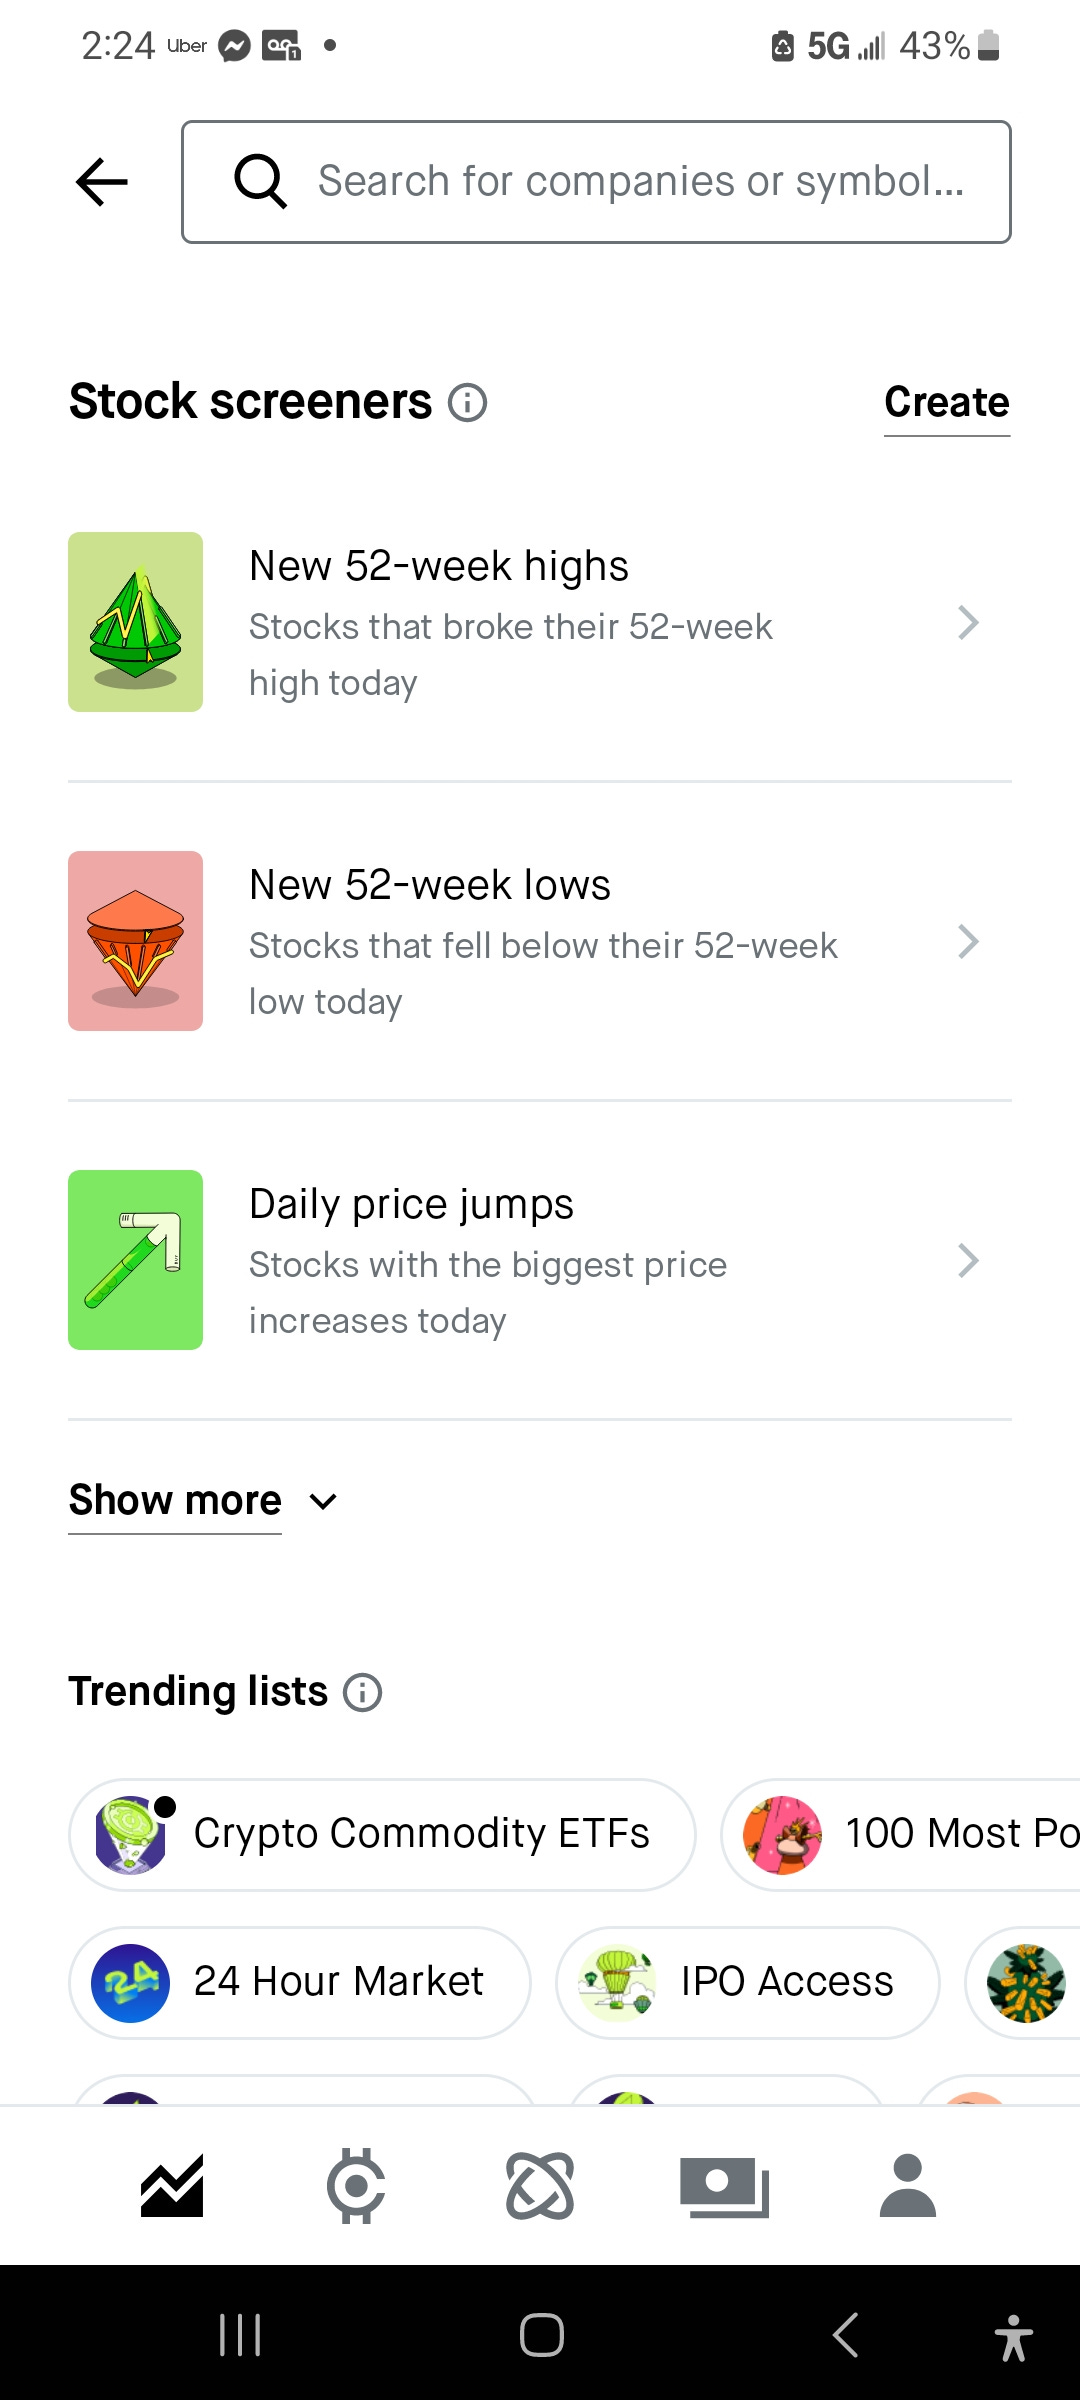
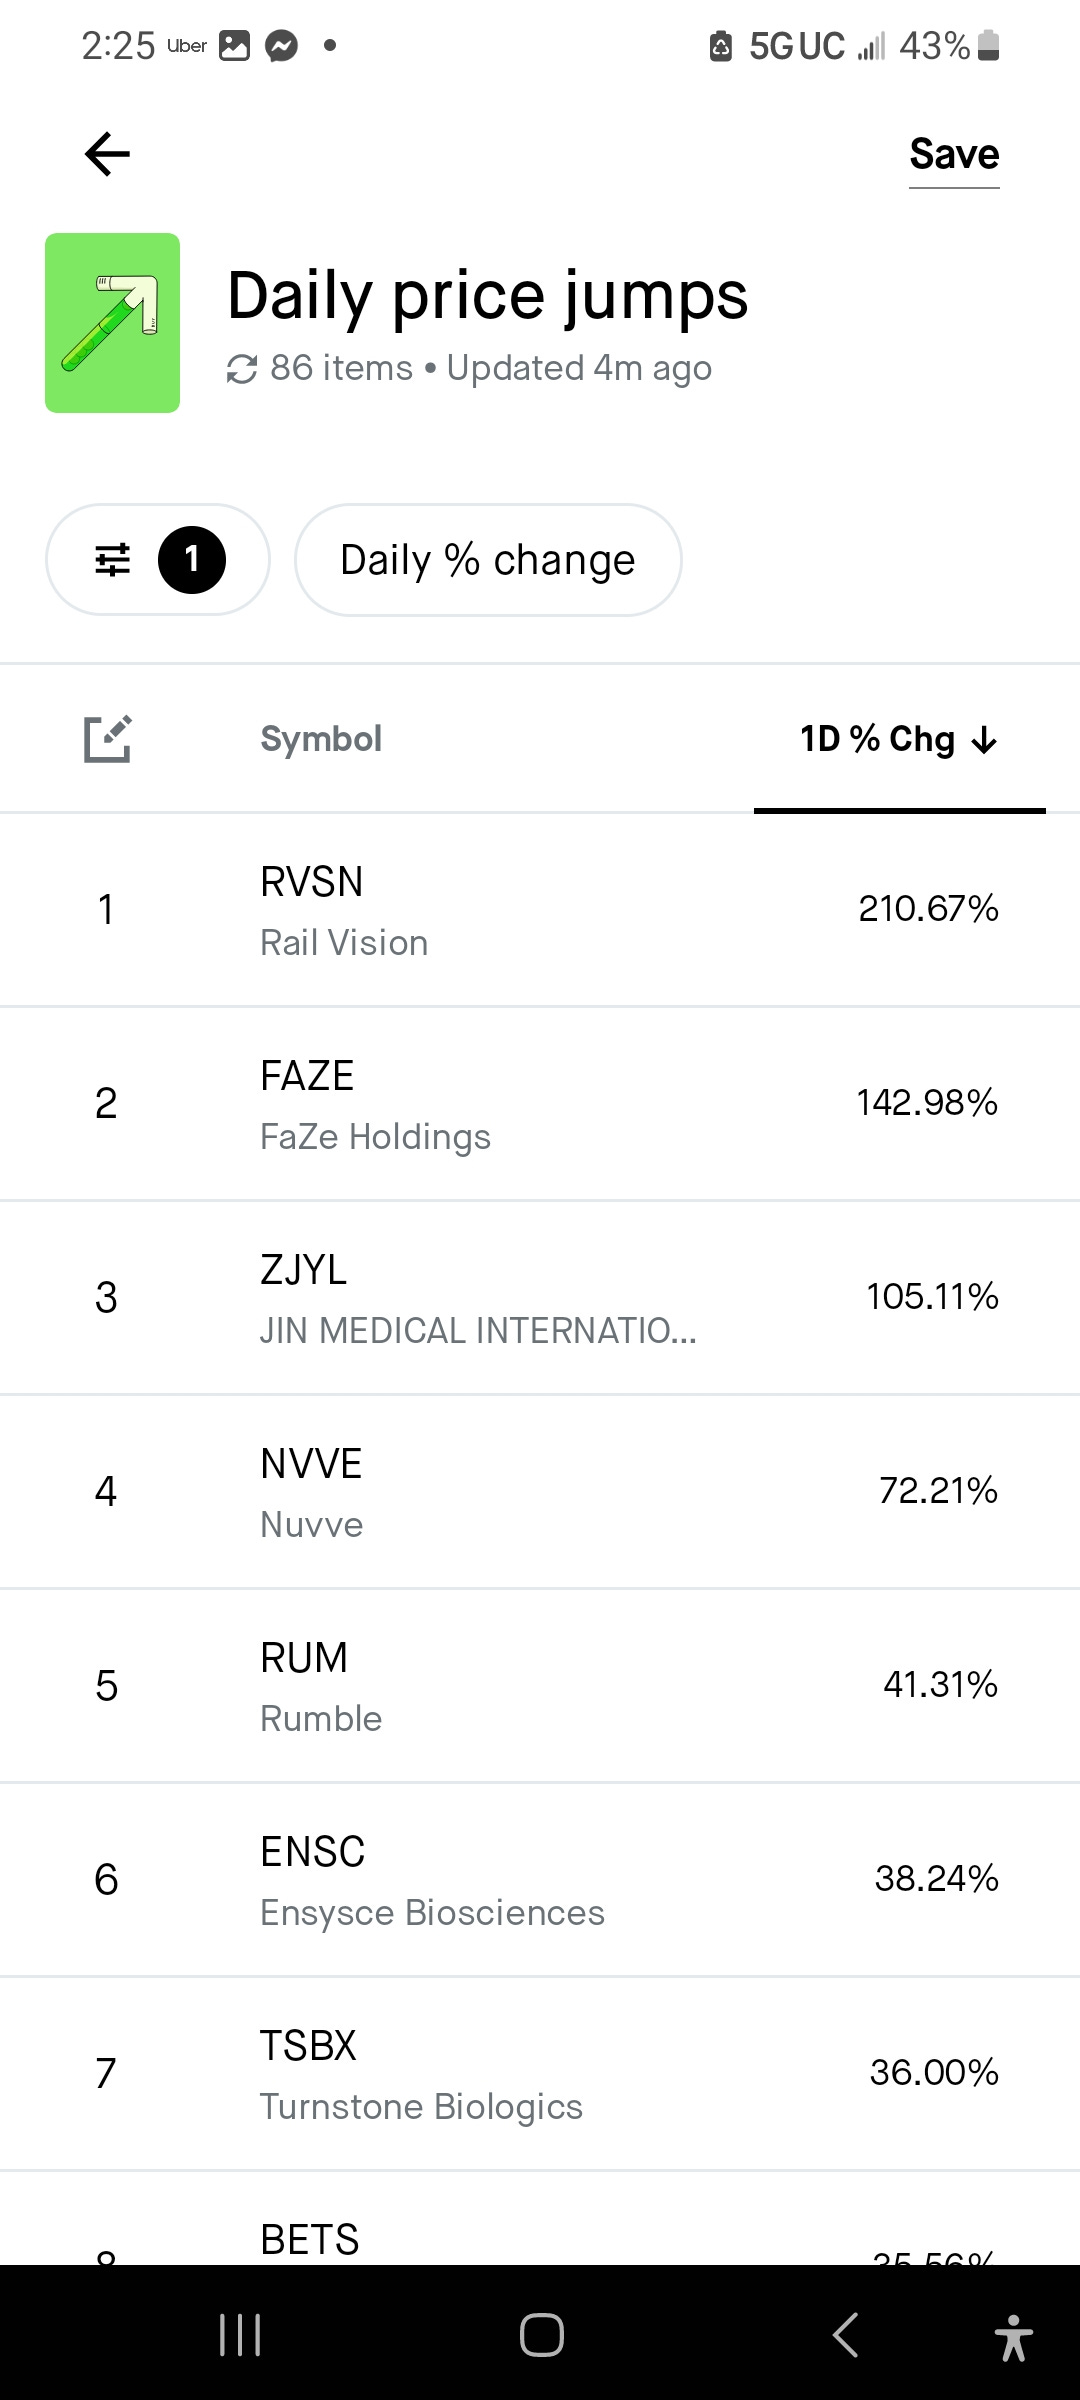
If I am looking for stocks/coins that are about to break out with a 20% move or more, the first place I go is the daily price jumps chart on Robinhood as shown below.
My next move if I am looking for a breakout of a large trend, I will look for stocks that have gained a decent percentage 10%-20% and up, before the market opens. I then open up each of those charts and look for ones where after a long ladder down, finally price has laddered the opposite direction on the daily or weekly chart.
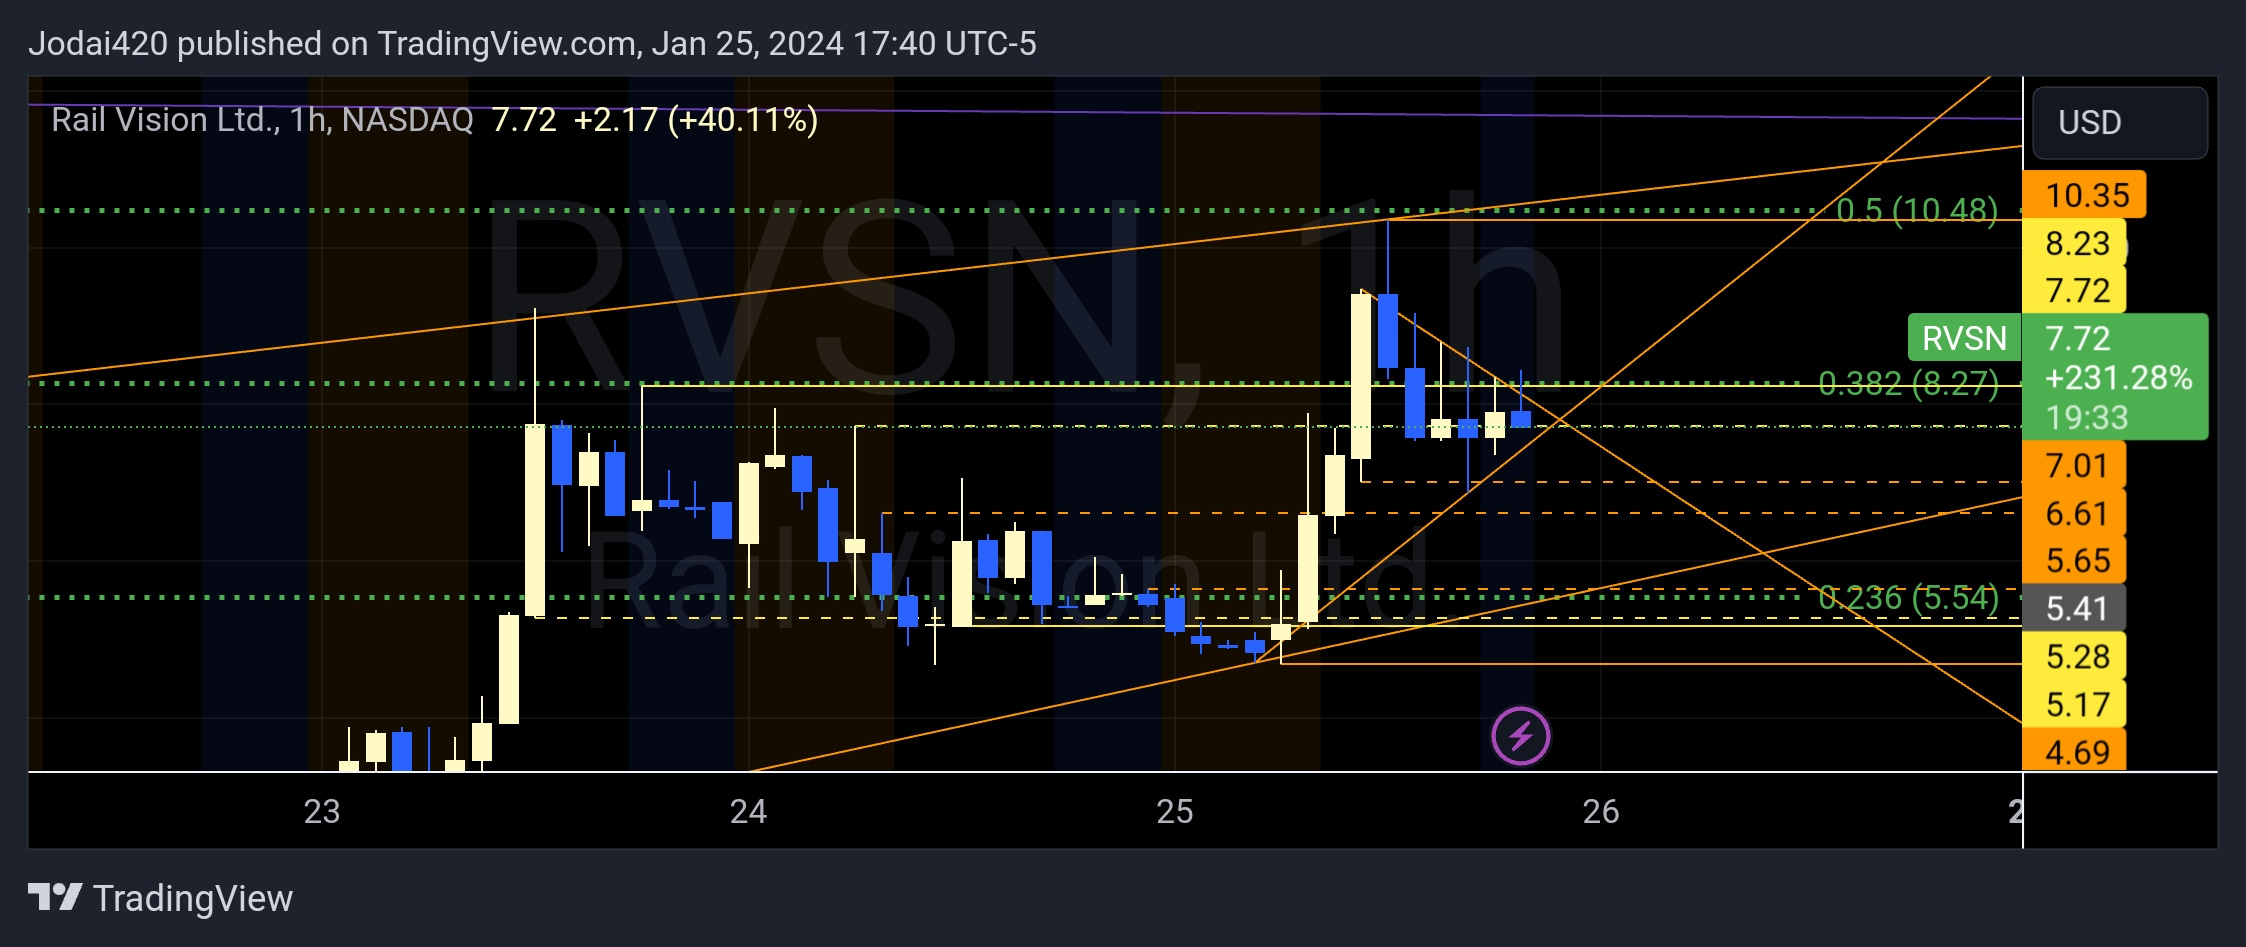
Once I identify which stocks meet the above criteria, I move on and toss a topside legacy trend on the chart and then toss a fibb onto the last monthly or weekly valley that price is currently retracing. If price has already hit the .618 or .715 Fibb retracement levels, you know that move is dead until it finds strong support again. I notice these stocks like to make a 10-20% move up before coming back down and finding support on the strong hold level, before being sent skyward 50%-100% and higher over the next couple of days to a week.
When I am searching for volatility, I start my search the same way. The main difference here is I am looking for volatility once the trading day is under way. That allows for stocks/coins to make serious gains that people then sell off.
I am looking for the stocks/coins that have already had their sell off that morning and have found support down below. Identify what time frame hold level held the move up. Once price ladders up from the support it found, I will enter into a trade when price comes down on top of the hold level on the next time frame down.
If price ladders off a 4hr hold, I am looking to enter on the 1hr hold, when price drops down to that hold level. Once here, you can use a fibb from the top of the valley to the bottom and then look at where your .618 fibb is at. This will allow you to determine if there is enough meat on the bone to make it worthwhile breaking this chart down even further using break and hold levels.
Once I determine what can be made, and it is worth the time breaking the chart down is when I figure out what time frame levels we are bouncing in between, and where my trends are outlining the wedge which the move will take place in until it reaches the end of the wedge. This is known as a point of polarity, and the end of the wedge will have the topside or the bottom side of the moves break levels down to the 5,3, and 1 minute time frames before a large move happens. Once the 1 minute break level is lost, that valley/peak has been lost and a large move in the direction the peak was lost, is about to happen.
As seen in the chart below, price explodes out of these points of polarity. At $5.28 we see price 1st touch the 4hr hold level, while also reaching the bottom of the trend line before the explosion. Resulting in 93% move up on the 25th.