

Free Weekly Bitcoin Price Prediction 09/30/2025: BTC Coiled Between $113K and $116.5K — Is the Q4 Rally About to Begin?
Bitcoin is pinned between $113K support and $116.5K resistance. The 50 EMA Bollinger Band is about to expand. History says Bitcoin rallies in Q4. The question is: will BTC repeat—or surprise us all??


Quick Take
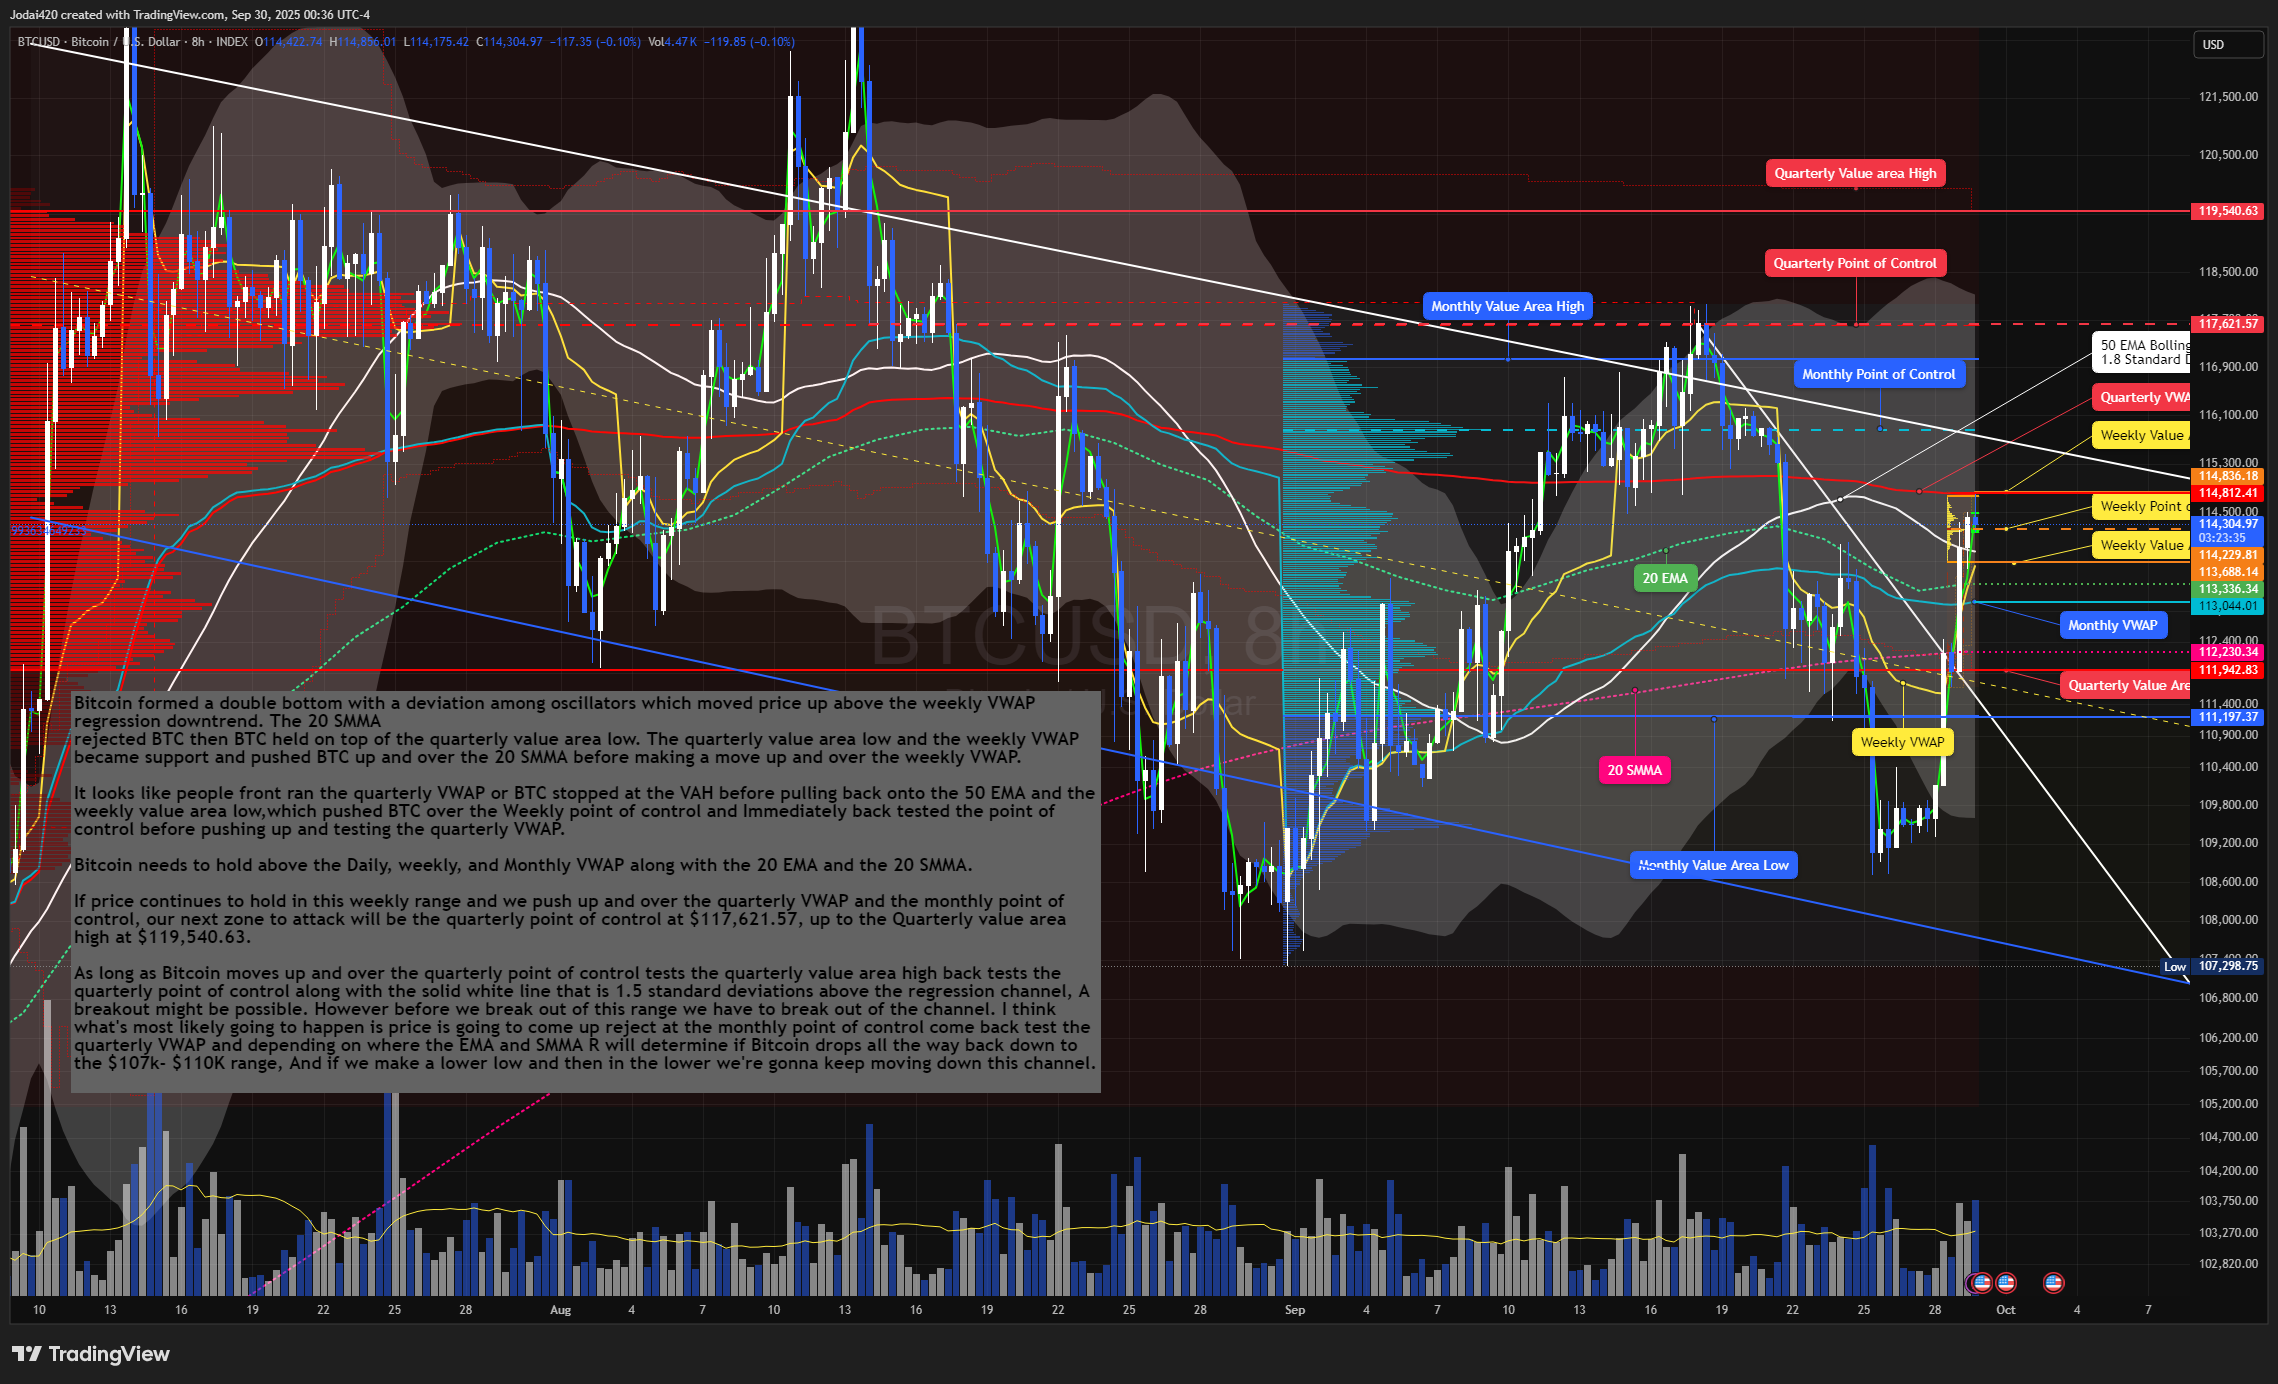
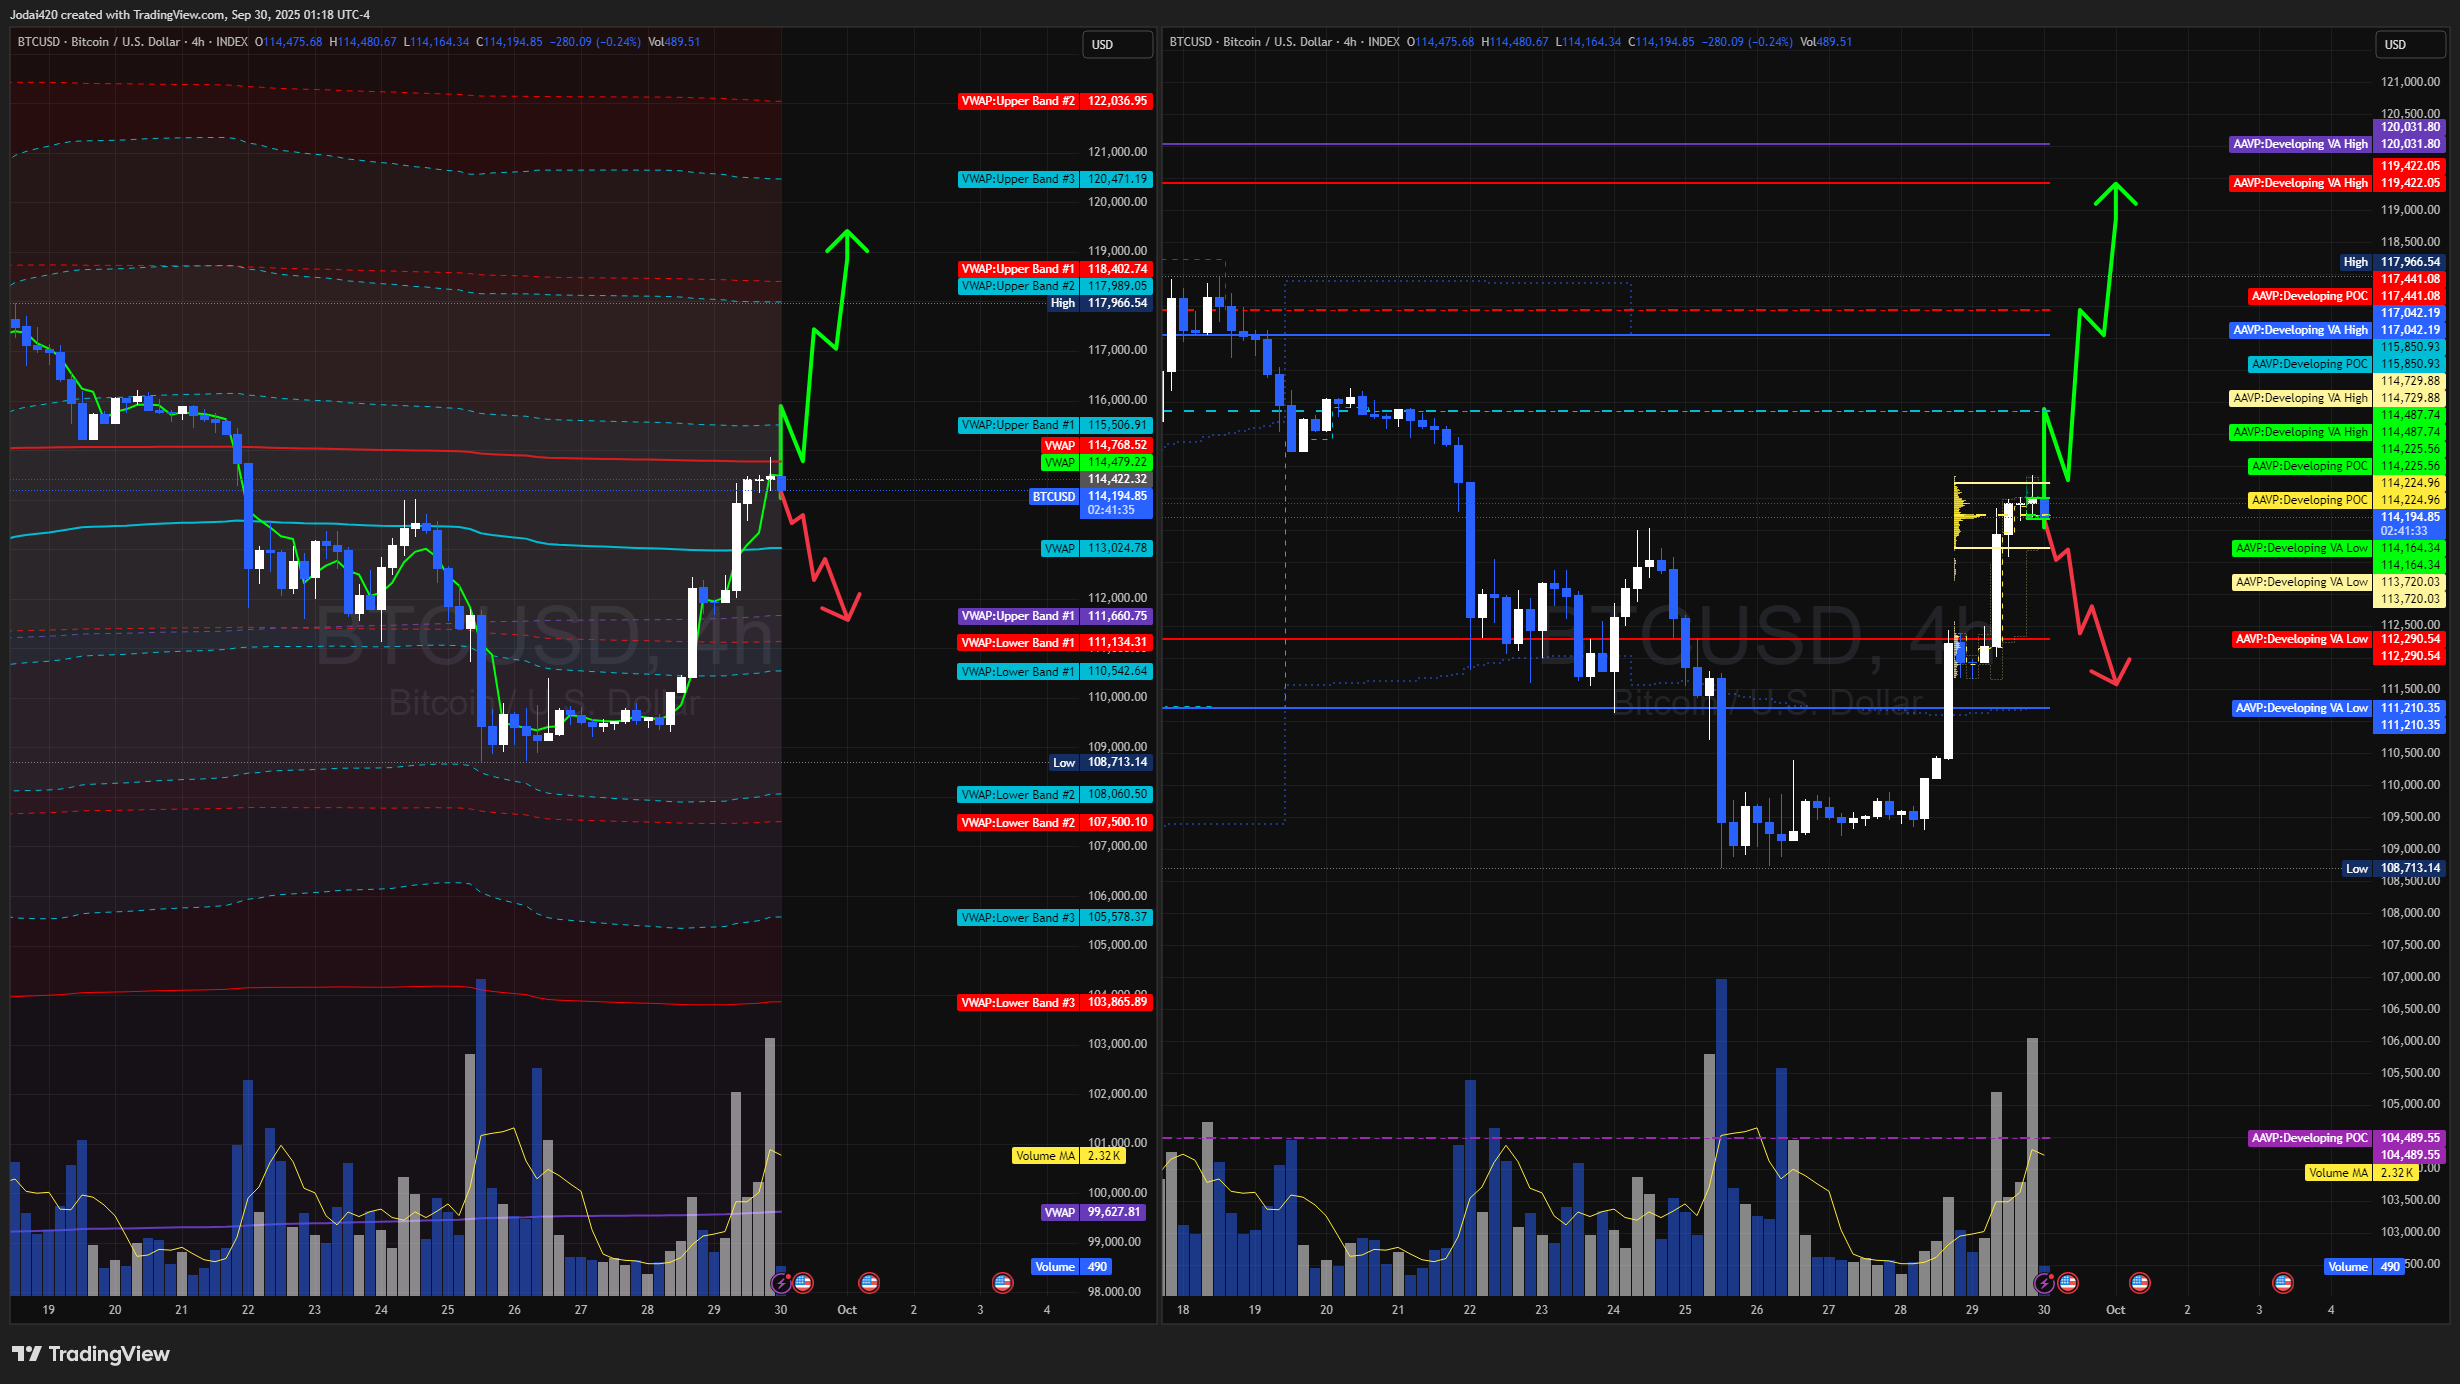
Bitcoin (BTC) is trading near $114,200 (September 30, 2025).
Price reclaimed the weekly and monthly VWAPs, defending the $113K base.
BTC now tests the quarterly VWAP at $116.5K, which aligns with the upper 50 EMA Bollinger Band (1.8 SD).
Upside path: $117.6K → $119.5K → $121K.
Downside risk: $113K → $111K → $107K.
Seasonality: We are entering the last quarter of the year, a period when Bitcoin historically “goes for the moon.” The question: will 2025 follow tradition, or break the cycle?
Review of Last Week’s Prediction
Last week we defined $111K as the pivotal levels.
Bullish scenario: Holding above $112K opened the door to $117K–$120K.
Bearish scenario: A breakdown below $110K risked a flush toward $107K.
What Went Right
Demand absorption near $111K–112K was correctly identified as critical support.
Intraday traders profited from rebounds as BTC reclaimed the weekly VWAP.
Risk discipline worked. Stops under $110.5K protected against deeper volatility spikes.
What Stalled
Swing targets toward $117K–$120K failed to materialize.
BTC stalled under $116.5K, proving that level is still the market’s line in the sand.
Key Takeaway
Our framework preserved capital and delivered profitable intraday opportunities. However, until Bitcoin decisively breaks $116.5K, upside momentum remains capped.
Seasonal Context: The Q4 Effect
Bitcoin is entering the last quarter of 2025, a time when historical patterns show strong rallies.
From 2016 through 2021, Q4 consistently brought outsized gains:
2017: Q4 run-up that ended in the December peak.
2020: Post-halving bull run, ignited in Q4.
2021: Secondary high formed in Q4 after a mid-year correction.
“Every year, Bitcoin tends to make its strongest move in the final quarter. The real question is whether 2025 will continue this rhythm — or mark a rare divergence.”
Traders are preparing for one of two outcomes: another classic Q4 surge toward highs, or a break from seasonality if macro conditions cap risk appetite.
Market Structure: Double Bottom Foundation
BTC has rebounded off a double bottom reversal pattern:
First trough: ~$111K.
Second trough: ~$112K with bullish divergence.
Confirmation trigger: Reclaim of the weekly VWAP and the 50 EMA midline.
This double bottom sets the stage for a breakout test of $116.5K.
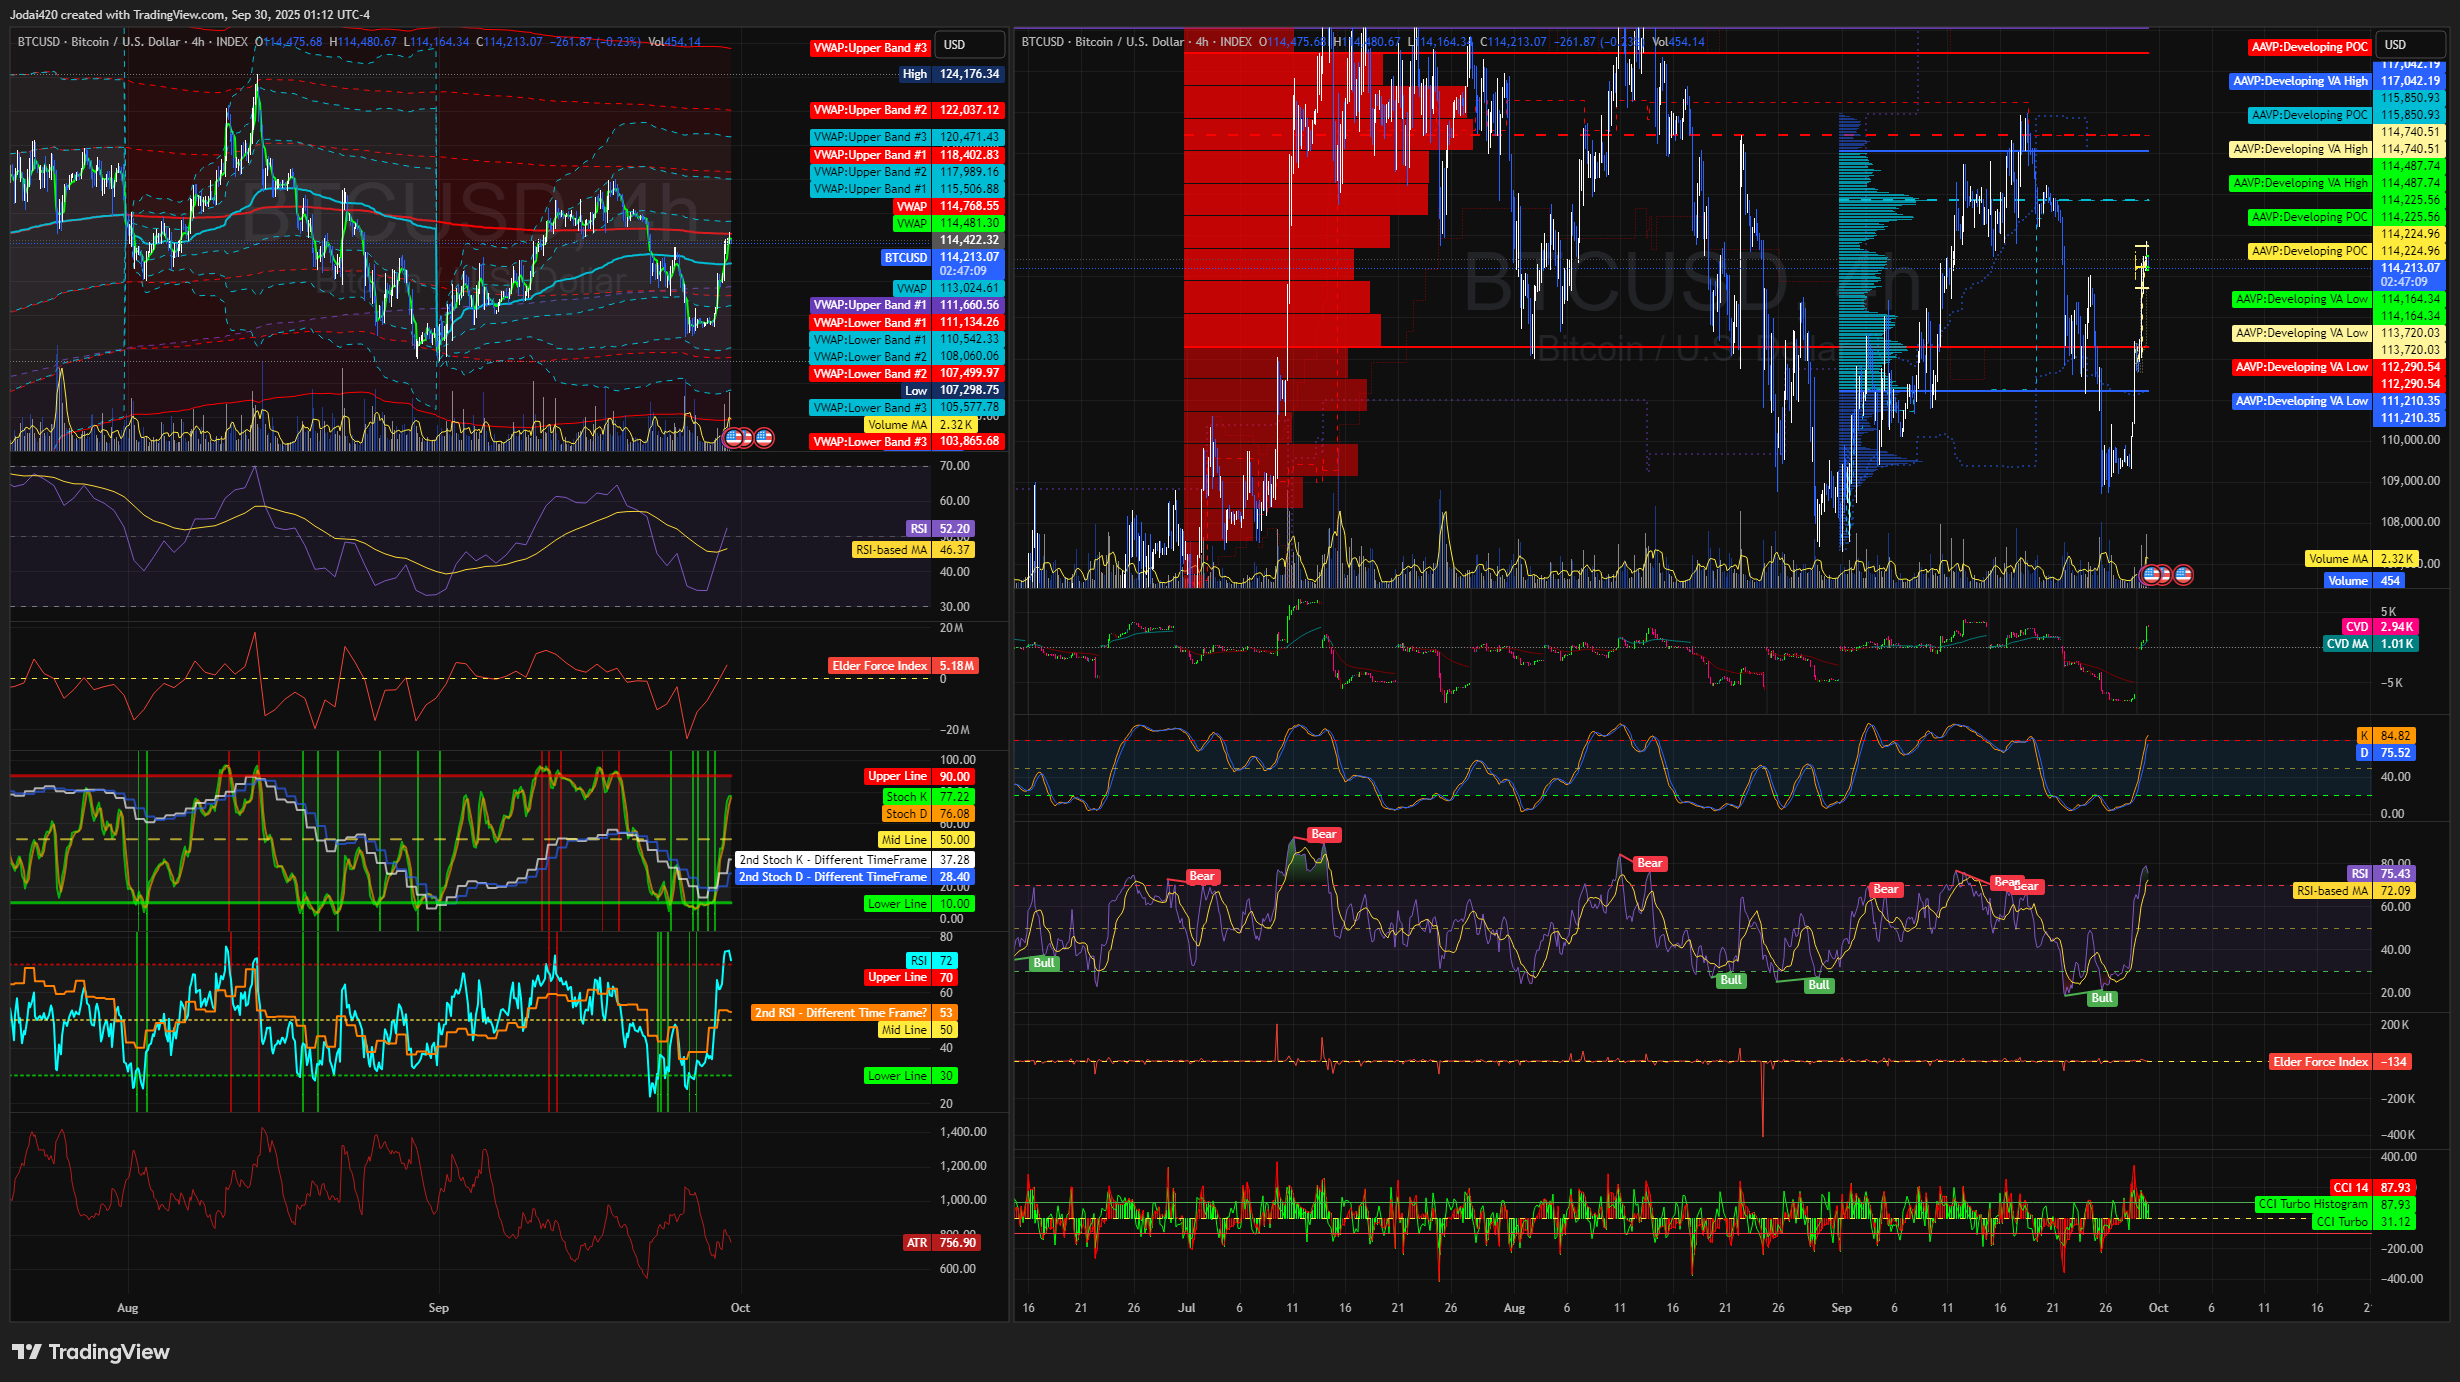
Technical Analysis Across All Charts
50 EMA + Bollinger Band (1.8 SD)
The 50 EMA and its 1.8 standard deviation Bollinger Bands frame the volatility corridor:
Midline (50 EMA): ~$114K. BTC oscillates slightly above it — a bullish tilt.
Upper Band (~$116.8K): Converges with quarterly VWAP. A breakout here signals volatility expansion higher.
Lower Band (~$111K): Aligns with weekly demand. A breakdown would re-open the path to $107K.
“BTC is coiled between the midline and the upper Bollinger Band. The squeeze will expand — the only question is whether it’s up or down.”
VWAPs and Value Areas
Weekly VWAP: Reclaimed, offering local support.
Monthly VWAP: Beneath price, reinforcing the floor.
Quarterly VWAP ($116.5K): The current battlefield.
Quarterly Value Area High ($119.5K): Next upside magnet.
Quarterly Value Area Low ($112.3K): Immediate floor.
Quarterly Value Area Low ($112.3K): Acts as the near-term floor.
Volume Profile and Liquidity
The volume profile highlights:
Thick bid absorption at $111K–113K.
A low-volume pocket above $116.5K.
This creates a scenario where, if BTC clears resistance, it can sprint rapidly into $119.5K with little friction.
Oscillators & Momentum
RSI & Stochastics confirm divergence from the double bottom.
ATR rising: expect larger swings.
CVD shows accumulation by whales around $113K, flipping supply into demand.
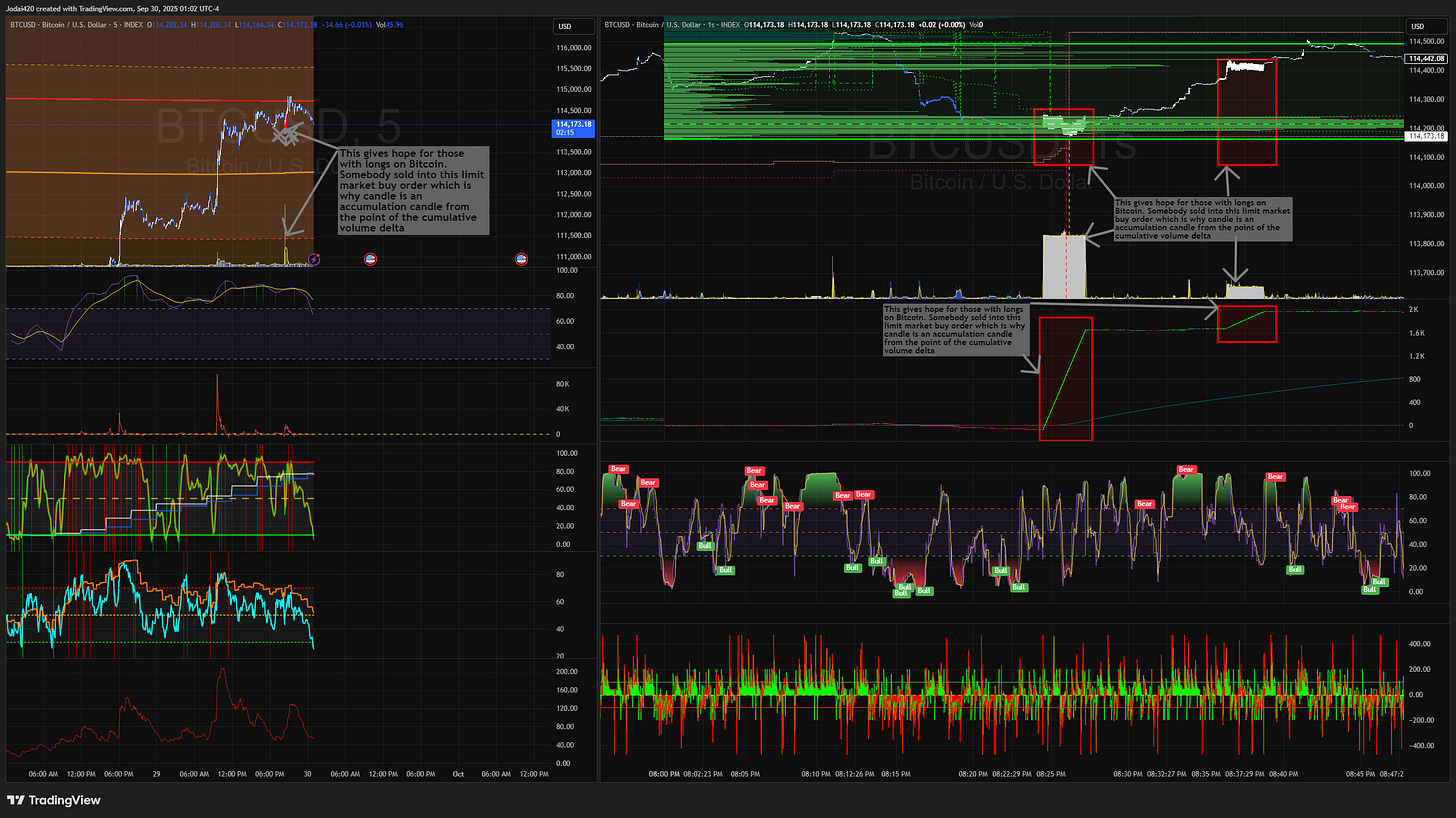
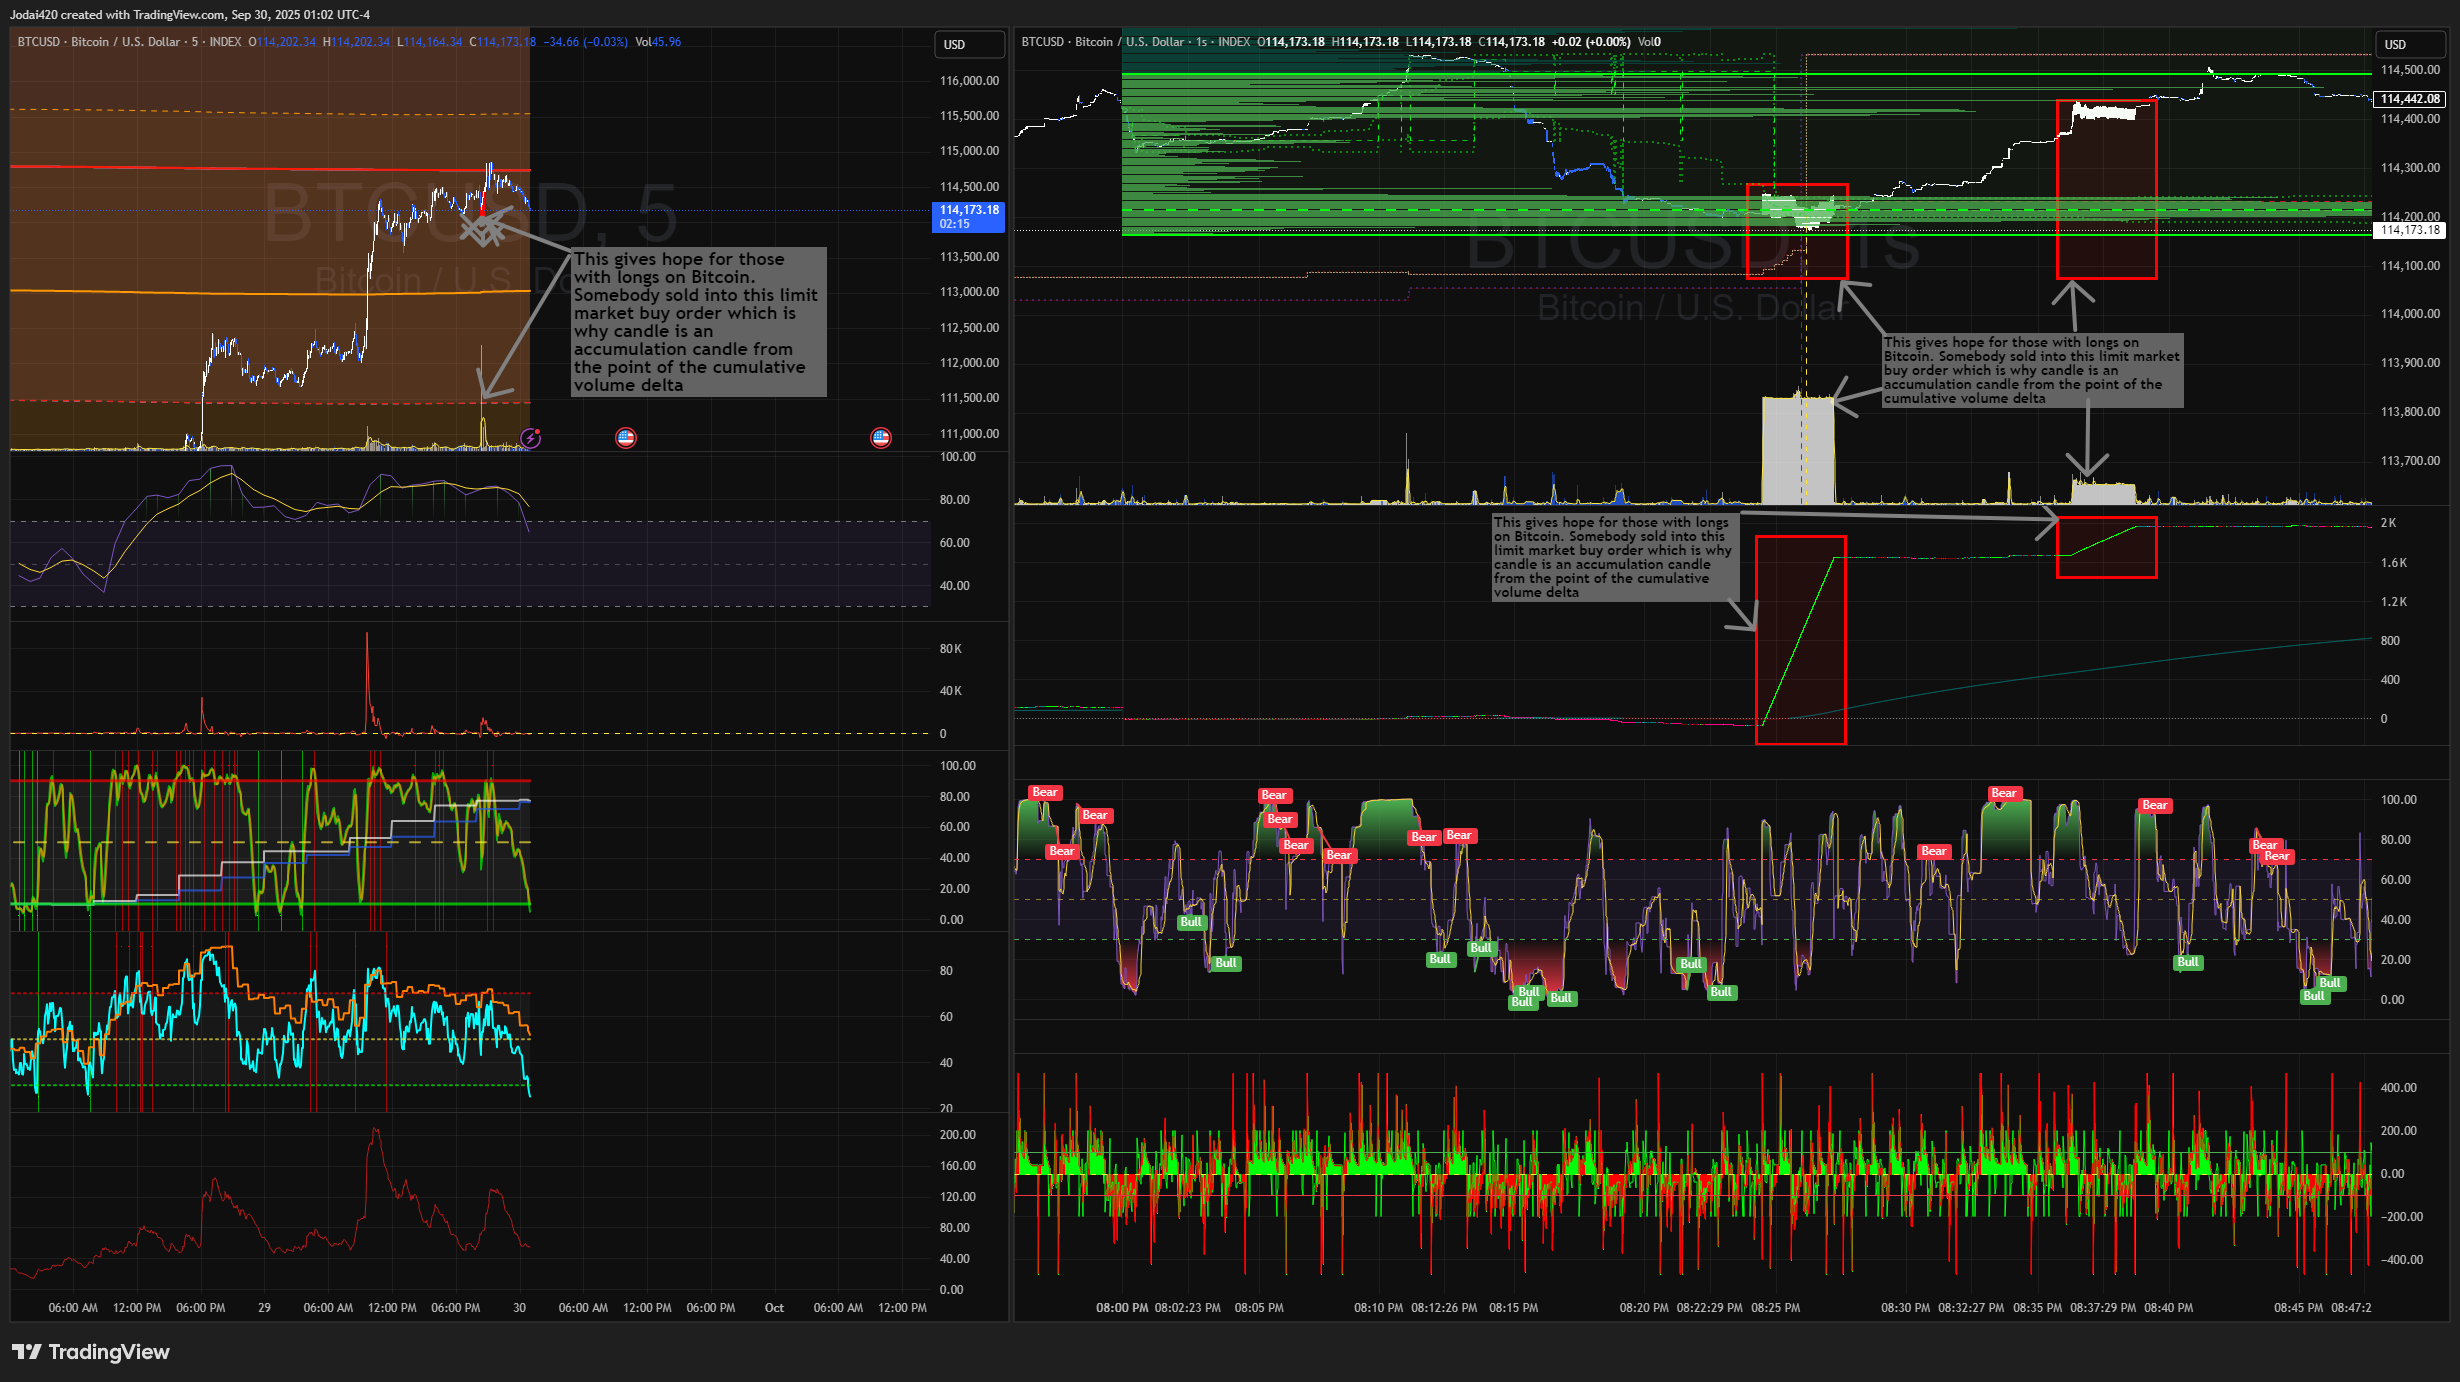
Recognizing Large Buys on Bitcoin
One of the most reliable ways to anticipate trend shifts is by identifying when whales step in with large buys.
Cumulative Volume Delta (CVD)
Tracks aggressive buying vs aggressive selling.
A sharp rise in CVD while price holds flat or dips = whales absorbing sell pressure.
On recent charts, this created accumulation candles, where sellers hit bids but price failed to break down.
Absorption Candles
Form when heavy selling volume is absorbed by equally heavy buying.
Visible as volume spikes without price collapse.
Often signal institutional accumulation zones.
Liquidity Pockets
Look for large bid walls around round numbers ($113K).
Price tends to bounce from these zones because of the liquidity cushion.
Volume Spikes at Support
A surge in volume at VWAP or anchored profile levels, without breakdown, is often the footprint of large buyers.
“Large buys reveal themselves not through headlines, but in the tape. When sellers can’t push price lower despite heavy volume, it’s usually whales positioning for the next leg up.”
Scenarios for October 2025
Bullish Path
Hold 50 EMA midline, and Monthly VWAP.
Break above upper Bollinger Band + quarterly VWAP at $116.5K.
Accelerate into $117.6K → $119.5K → $121K.
Bearish Path
Rejection at $116.5K.
Drop below 50 EMA and midline (~$114K).
Retest $112.3K → $111K demand.
Break lower Bollinger Band risks $107K channel support.
Bitcoin Price Prediction October 2025
Base Case: Rangebound $113K–$116.5K until breakout resolves.
Bullish Case: Break $116.5K → rally accelerates into $119.5K–121K.
Bearish Case: Rejection → drop to $111K–107K.
Bias leans bullish as long as $113K holds.
The probability tilts bullish, but only if BTC clears $116.5K with conviction.
Risk Management and Trading Psychology
Stops Below $113K: Essential to avoid drawdown if support cracks.
Patience at Resistance: Wait for volume confirmation & backrest of breakout resistance before chasing a breakout above $116.5K.
Seasonal Bias vs. Discipline: History favors Q4 rallies, but trading decisions must remain data-driven, not emotional.
Position Sizing: ATR expansion means volatility risk is higher. Adjust position size accordingly.
Position Size Formula
Position Size: (shares)=Dollar RiskStop Distance\text{Position Size (shares)} = \frac{\text{Dollar Risk}}{\text{Stop Distance}}Position Size (shares)=Stop DistanceDollar Risk
Example:
Dollar Risk = $500
Stop Distance = $1.80
Position Size = 500 ÷ 1.80 ≈ 278 shares for this example.
Check Position Value
Shares × Entry Price = total exposure.
Example: 278 shares × $63 = ~$17,500 position size.
Define Account Risk
Decide % of account you’ll risk per trade.
Example: Risk = 1% of $50,000 = $500 max risk per trade.
Find ATR Value
Look at the current ATR(14) on your chart.
Example: ATR = $1.20 (meaning the stock typically moves $1.20 per period of your charts time frame).
Set Stop Distance
Decide how many ATR multiples define your stop.
Common: 1x ATR, 1.5x ATR, 2x ATR depending on strategy.
Example: Stop = 1.5 × ATR = $1.80.
“Capital preservation comes first. The opportunity only matters if you’re still in the game.”
Investor Takeaways
$116.5K is the pivot. Breakout or rejection defines October.
Volume favors upside. Above resistance, BTC has clean air to $119.5K.
Whale footprints confirm accumulation. Institutions defended $113K.
Q4 seasonality looms. Historically bullish, but not guaranteed.
Risk discipline is key. Stops and size adjustments matter more now than ever. Don't over leverage your account on a single trade, where our emotions could cause us to exit the trade before your stop loss or to enter before all entry conditions have been met.
Final Word
Bitcoin sits at the crossroads of support and resistance. The 50 EMA Bollinger Band corridor defines the volatility boundaries, and the quarterly VWAP at $116.5K is the gatekeeper.
“Every Q4, Bitcoin has made its strongest move. The only question is whether 2025 will repeat history — or defy it.”
A breakout above $116.5K clears the path to $120K. A rejection reopens $111K–107K. Traders should let the market prove itself before committing to an always in direction & the size of the trade using the ATR volatility sizing formula.
This analysis blends technical structure with institutional-grade risk planning, which is ideal for both short-term traders and mid-term investors.
Disclaimers:
This is not financial advice. Always speak to a certified money manager before making any financial decisions. This analysis represents the daily musings of an intraday trader.
Statement of Uncertainty:
(Fail-Safe Rule)
This analysis verifies that the provided text uses legitimate financial concepts, terminology, and theories correctly within the framework of technical analysis. However, the accuracy of the market predictions themselves cannot be established. All financial forecasting is inherently speculative and subject to significant uncertainty. The outcome of the described scenarios is not knowable in advance!!!
Support my work, consider becoming a free or paid subscriber!!
Intellectual Dissatisfaction is a reader-supported publication. To receive new posts and support my work, consider becoming a free or paid subscriber.
