Buffett Indicator at 219% – Are Stocks Entering Bubble Territory?
The Buffett Indicator (total U.S. stock market cap-to-GDP) has soared to ~219% in 2025, far above prior peaks during the dot-com and housing bubbles, and well beyond its historical average (~86%)
Fundamental Analysis and Technical analysis contained in this post was performed by Andrew Jodiceof Markets, Liberty, & Discipline. He’s studied and blends Al Brooks’ theory, Richard D. Wyckoff’s theory, and Charles H. Dow’s theory to conduct his analysis, and implements Al Brooks’ strategy to execute trades.
Buffet Indicator (Significantly Overvalued)
The U.S. stock market has surged to historic valuation extremes. One striking metric, the Buffett Indicator, now registers around 219%, meaning the total U.S. stock market is worth over 2.19 times the nation’s GDP. For context, the long-term average of this indicator is roughly 86% according to finviz.com. In other words, by this measure the market’s size dwarfs the economy to an unprecedented degree. Such an elevated reading raises an urgent question for investors: Has the stock market become a stock market bubble signaling overvalued equities and lower future returns? We’ll explore the significance of this 219% reading, draw parallels to past boom-bust episodes, and discuss what it all implies for a U.S. market crash risk regarding your portfolio.
The Buffett Indicator Hits an All-Time High
This unprecedented valuation highlights the extent of today’s overvalued equities and is fueling concerns about sustainability.
The Buffett Indicator – named after Warren Buffett, who called it “probably the best single measure of where valuations stands,” compares the aggregate U.S. stock market cap to the USA’s GDP according to Investopedia. At 219%, the Buffet Indicator is flying higher than a festival goer at 2:00AM!
To put this into perspective, even at the greatest heights of euphoria in the past, the ratio never approached anything like today’s levels. The dot-com bubble peaked around 136% in 2000, and the housing bubble peaked near 100% in 2007 according to Investopedia. Those episodes were followed by severe market downturns and yet todays current valuations are double the housing bubble and almost double the dot-com bubbles. It’s no wonder Buffett himself cautioned that when this indicator nears 200%, investors are “playing with fire.” Especially given the downside risk that has historically followed extreme Buffet Indicator readings according to Gibson Capital.
Such a record-high Buffett Indicator suggests the market is “significantly overvalued” by historical standards according to Guru Focus. Put simply, stock prices have grown far faster than the economy. This doesn’t guarantee an imminent crash, but it strongly hints that equities aren’t exactly priced for perfection. Many market valuation metrics in U.S. stocks have never been this expensive. Elevated price-to-earnings ratios, price-to-sales ratios, and CAPE (cyclically adjusted P/E) all corroborate the story. That valuations are stretched well above long-term norms according to Sam Ro of tker.com. As a result, even Federal Reserve officials have noted that asset prices appear “fairly highly valued” as of late. Which is a polite way of saying stocks look outrageously priced relative to those stocks fundamentals.
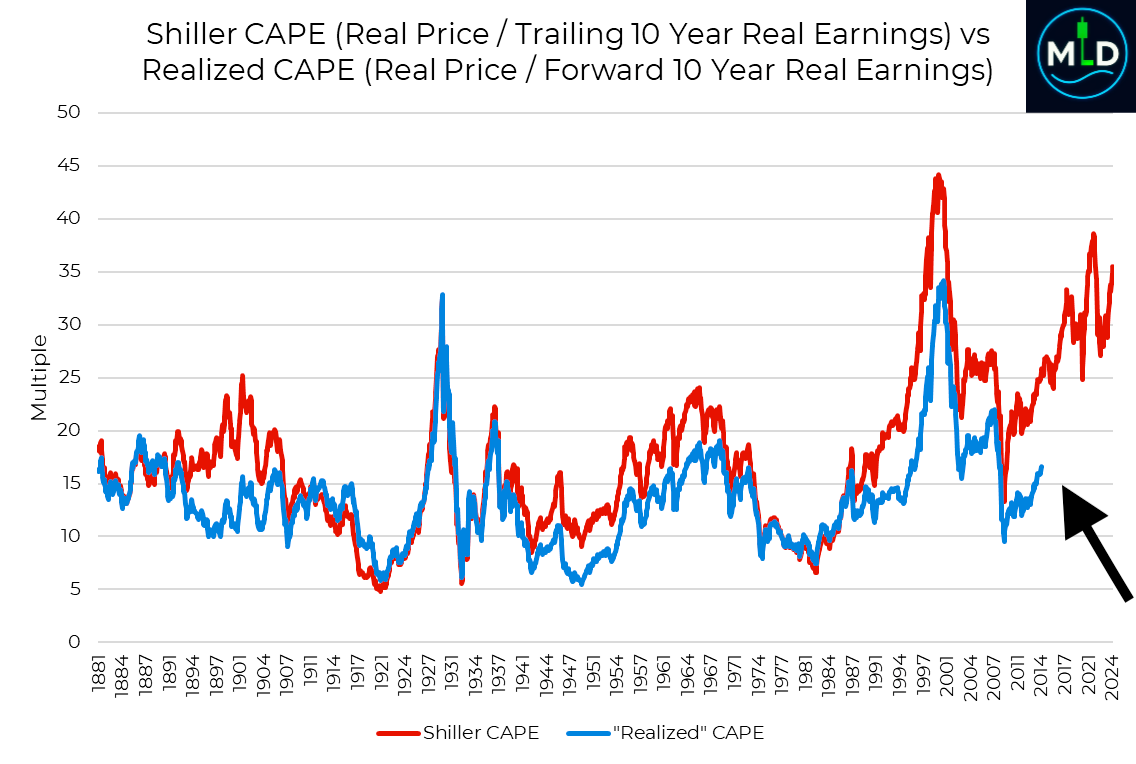
Behold: The forward-realized CAPE
But what if there were a P/E ratio where the E was based on the next 10 years’ earnings? It would be a ratio that combines the strengths of the forward P/E and CAPE.
While we can’t accurately predict earnings through 2035, we have the ability to go back in time to 2015 and beyond to calculate what this “forward-realized CAPE” would’ve been based on actual earnings reported.
In other words, up to 2015, we can calculate a valuation ratio using the average of the next 10 years’ realized earnings to understand whether the market was actually cheap or expensive at the time.
Shiller’s CAPE is in red and the CAPE based on the forward-realized 10-year earnings is in blue.
In mid-2014, Shiller’s CAPE was at about a 26x, significantly above its long-term average of about 17x. By this metric, the market already looked expensive, meaning investors should’ve expected weak, low-single-digit returns.
But the realized CAPE at the time was about 17x. Eyeballing it, this metric was roughly in line with its long-term average and below its average from the prior 20 years.
The realized CAPE was telling us the market was not expensive in 2014. Why? Because earnings growth proved healthy in the years that followed.
“Important re-framing,” Bloomberg’s Joe Weisenthal said about the chart. “People like to blame the Fed or ETF flows for the big bull market. But the fact of the matter is that the realized earnings of big American companies have been extraordinary both on an absolute basis and also on a relative (to estimates) one for years.“
Echoes of Past Bubbles: Dot-Com and Housing Parallels
Investors have seen this movie before. Late 1990s optimism drove the Nasdaq to dizzying heights, pushing the Buffett Indicator to roughly 1.3x GDP (about 136%). When the dot-com bubble burst, the S&P 500 plunged by roughly 50%, and the Nasdaq by nearly 80%, over the ensuing two-year bear market. Similarly, excessive confidence in the mid-2000s drove the Buffett indicator up to 1.0x of USA’s GDP, (~95–105%) before the 2008 financial crisis. In both cases, stocks dramatically outpaced economic reality. When it came time to pay the piper, a painful market reversion followed. The Buffett Indicator retreated toward more “normal” levels as equity values collapsed and GDP kept chugging along.
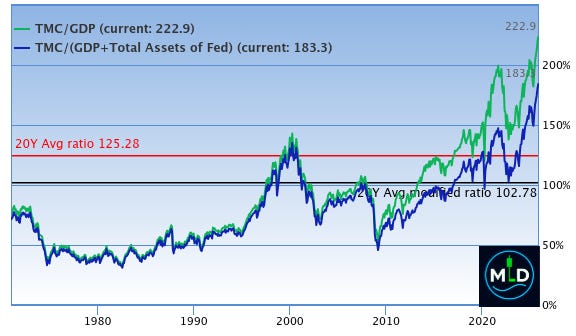
Total Market Cap and US GDP
A Buffet Indicator with a reading of 219%, towers above the previous peaks. The gap between the USA’s market capitalization and the economy is far greater now, than before the last two major market crashes. History never repeats exactly, but it very often rhymes. The pattern is extreme valuations will eventually succumb to gravity. Meaning a bear market or at least a long period of flat or sideways returns while the stocks fundamentals catch up. The key difference now is the order of magnitude of the extremity of the current situation. If 136% signaled wild exuberance in 2000, what does 219% signal in 2025? At a bare minimum, it suggests we are in some very uncharted waters. Valuation alone isn’t a timing tool. The reason being that markets can stay frothy for far longer than any analyst, hedge fund manager or retail trader ever expects. However, it does tell us one important factor. Risk in the markets is elevated to levels we have never seen before. As Buffett quipped, “you only find out who is swimming naked when the tide goes out.” At 219%, the tide is above even the worst investors heads, and any negative shock to the market will reveal just how exposed investors in the market really are.
The Ratio of Total Market Cap to US GDP
It’s important to note that high valuations don’t cause crashes by themselves. We often have a catalyst. Such as a tightening of monetary policy, a earnings disappointment, a geopolitical shock, etc. But rich valuations amplify the impact of such catalysts. In 2000, the catalyst was rising interest rates and failing dot-com business models. In 2008, it was the mortgage backed securities and the credit crisis that wiped out Lehman Brothers on September 15, 2008. Lehman Brothers was the largest bankruptcy filing in U.S. history, with $639 billion in assets and $613 billion in liabilities. The collapse triggered a global financial crisis, leading to a widespread economic downturn and job losses. Today, one can speculate about what the trigger might be (rising bond yields, an inflation resurgence, recession risks, over indebted AI companies who still don’t have a profitable business model or another unexpected shock). Whatever the spark, an overstretched market has farther to fall when reality bites. That’s why the Buffett Indicator’s record level is worrying – it suggests fragile underpinnings, where even a modest disappointment could snowball as investors rush to lock in gains. To put it bluntly, don’t be the investor who is left holding the bag of stocks once the institutions push the prices of stocks below the 365 SMA.
Valuation Excesses and What Comes Next
The Predicted and the Actual Stock Market Returns
What do these extremes imply for forward returns? Unfortunately for the bulls, numerous studies and experts find an inverse relationship between starting valuations and subsequent long-term returns. When stocks are this expensive relative to the economy, future returns tend to be low. For instance, Guru Focus estimates that at the current Buffett Indicator level, the implied annual return for U.S. stocks in the coming years is around –0.5% (yes, negative) including dividends. In other words, from such heights the market may deliver essentially flat or very modest gains at best over the next decade. Likewise,
of tker.com’s analysis noted that “many popular valuation metrics suggest that the stock market is expensive, implying that investors should expect weak returns in the years to come.” This doesn’t guarantee poor returns. It certainly doesn’t pinpoint when a correction might happen. The odds of enjoying the kind of easy double-digit annual gains we saw in 2020–2021 are much more difficult to attain this time around. Trees don’t grow to the sky, and neither do equity multiples!
Crucially, stretched valuations also raise the stakes for the economy and for company earnings. When price-to-earnings ratios are extreme, any hiccup in earnings growth or a jump in interest rates can prompt a sharp sell off. We’ve already seen the Federal Reserve hiking rates off zero in the past two years. Typically this puts pressure on lofty stock valuations. Why pay such a premium for stocks when an investor can get risk-free treasuries that yield 5%? As Buffett has noted, higher interest rates act like “gravity” on asset prices quoted from an article by Guru Focus. Markets have largely shrugged off rate increases. Perhaps investors are betting on a goldilocks scenario of strong earnings and eventually lower rates. That rosy outcome leaves little margin for error. Any disappointment in any of the parameters discussed in this article, be it an economic slowdown, an earnings miss, or more persistent inflation driving rates even higher, would be effective at forcing investors heads above the sand to realize the valuation gap between stocks and USA’s GDP.
The Modified Predicted and the Actual Stock Market Returns
A market crash is obviously not a certain thing. Some argue that modern markets deserve higher valuations due to tech innovation, globalization of revenues, or structurally low interest rates despite recent hikes by the Federal Reserve. The U.S. economy today is different in composition from past decades where profit margins have been robust. It’s quite possible that “this time will be different.” At the very least different enough that the old valuation yardsticks need to be recalibrated. Betting that the market can defy economic gravity indefinitely is not just a risky proposition, it is an all around bad investing strategy, especially as we get closer to the end of our working lives. This is where betting the market can defy gravity indefinitely can cause a nice retirement nest egg turn into section 8 housing and a job as a Walmart greeter at 80. Investors portfolios should be slowly turned over to more risk averse assets as they age. I can think of nothing worse than hitting retirement, and a catastrophic black swan type of market crash happens as it did in the late 90s where the Standard & Poor’s(S&P) dropped 50% and the NASDAQ crashed 80%! At 80 years old, if that plays out, we better hope Walmart isn’t using Robot greeters!
Warren Buffett seems unconvinced that today’s prices are justified. Buffett’s Berkshire Hathaway has been one of the largest net sellers of stocks and builders of cash reserves over the last few years and accumulating $382 billion in cash, rather than risk fully diving into this volatile market. Buffett is known for being famously patient. His actions suggest he’s finding few bargains amid the volatile market froth. When the Oracle of Omaha prefers cash over stocks, it’s a sign that stocks are overvalued.
Excess valuation is a double-edged sword. On one hand, it reflects optimism and it can fuel further gains in the short run. Momentum and FOMO can keep inflating bubbles. On the other hand, it does limit long-term upside and it increases downside risk. A 219% Buffett Indicator tells us that the risk/reward balance for U.S. equities is increasingly skewed and that U.S. Equities are full of risk with little reward compared to a few years ago. Investors should be prepared for muted returns and the possibility of a swift regime reversal. As one market maxim goes, “the bigger the boom, the bigger the bust” – while we can’t be sure a bust is coming, we do know the boom has been extraordinary over the past decade.
How Should Investors Respond?
For long-term investors, these warnings don’t mean panic-sell everything. Timing the market is notoriously difficult. Bubble valuations can last longer than most analyst expect. Jumping out too early can mean missing gains. However, it’s prudent to be cautious and deliberate with ones investment strategy, when valuations are stretched this thin. Here are a few considerations for navigating the current landscape:
Rebalance and Diversify: Now is a good time to review your portfolio. After years of strong equity gains, your stock allocation might be higher than your risk tolerance would dictate. Consider rebalancing your portfolio by trimming some equity exposure. Especially from the most high-flying segments of the market. Ensure you’re well diversified across asset classes and sectors. Non-U.S. markets or value-oriented stocks, which in some cases trade at more reasonable valuations, could provide a good investment avenue if U.S. growth stocks stumble.
Increase Quality and Defensive Positions: In inflated markets, quality companies with solid balance sheets and reliable cash flows tend to hold up better during corrections. Emphasize businesses with proven earnings power. Avoid speculative names that have been bid up on hype. For example stocks such as RGTI,QBTS,QUBT,IONQ, and RKLB. If you chose to have speculative stocks, at least acknowledge that these types of stocks are more in line with extremely volatile MEME stocks). It’s also sensible to have defensive assets. For instance bonds. Bonds now offer yields investors haven’t seen in over a decade. Bonds provide a viable alternative for stable returns. A greater allocation to bonds or cash can cushion your portfolio if/when U.S. stock equities fall. This will also give investors cash on hand to buy stocks at cheaper levels down the road. Remember, in a downturn, “he who loses least wins.”
Temper Expectations: After a 10+ year bull run that was only punctuated briefly by the 2020 covid plunge, it’s easy to assume stocks will keep powering higher. They might, however given starting valuations, investors should expect lower returns with an overheated market. Financial planners often use an assumed equity return of, 5-7% annually for planning. At today’s extremes, even that may be optimistic. Investors should mentally prepare for the possibility that the next decade’s returns might be minimal compared to the previous decade. I think it will boil down to how the AI sector impacts every other sector. Investors might be staring down the barrel of a large portfolio drawdown within the next couple of years as AI kills off entire industries. This also creates a lot of opportunity for investors who have a forward thinking mind. This isn’t being pessimistic. It’s being realistic based on historical patterns. Everyone in finance loves to say past results don’t predict future results. However, when it comes to the world of investing and trading when a pattern is close, it is close enough to trade. Investors who plan their portfolios with conservative return assumptions will typically save more than those who don’t. The only thing left to do if cash is tight, is adjust spending to stay on track if the market is disappointing.
Stay Vigilant but Don’t Try to Time the Market Perfectly: Keep an eye on macro indicators such as interest rates, inflation, and earnings growth). If the Federal Reserve resumes tightening or corporate profits start slumping, the overvaluation beast may show its face sooner rather than later. ALWAYS avoid knee-jerk reactions to any headline in the news. In fact it is best to not even watch the news or pay attention to the news. By the time the news hits the Internet, never mind the TV pundits, that “Breaking News Bulletin” had been priced into the market already. I’ve also found that when the institutions have majority shareholder control over a newspaper company, they use the news as a tool to confuse investors. This is why stocks tank when it looks like great news was just released for a stock. Markets correct without news headlines and they can still crash in overvalued times, which means there will still be short-term rallies for the bulls. These rallies just aren’t meant for all-in or all-out moves. A better approach would be to incrementally adjust ones portfolio. For example, an investor might choose to tilt their portfolio gradually to become more defensive by raising cash levels bit by bit or writing covered calls for income. In investing the number one goal is to protect your capital and to be ready to take advantage of as many opportunities as we can when valuations normalize. As Warren Buffet famously said “Buy when there’s blood in the streets.”
Always keep the big picture in mind. Remember that long-term investors have endured bubbles and busts before, which means the investors of today can endure them by applying the proper risk management strategy to their portfolio. If as an investor you have a multi-decade horizon, the best course is usually to stay invested through market cycles, with one caveat. Investors need a portfolio that matches their risk tolerance, or as one of the Market Wizards famously said “Know your uncle point before entering a trade.”
Surviving a bear market is much easier for investors who haven’t overextended their capital at the top of the volatile frothy market. As the saying goes, “Bull markets make you money, but bear markets return stocks to their rightful owners.” When it comes time to cash out, make sure you’ll be one of the owners still standing, with cash ready to buy if and when a downturn returns stocks to their fair value price.
Conclusion: Caution and Perspective
The Buffett Indicator’s surge to 219% is a clear warning signal that market valuation is extremely high by any historical standard. While no one can predict exactly when or how this will resolve, the evidence of overvaluation is stronger now than ever according to the folks at Guru Focus. For general investors and retail traders, the takeaway is to stay informed and remain DISCIPLINED.
The market is likely in the late stages of a major market cycle. Which is typically a time when greed and fear suddenly rear their ugly heads. Thus, it’s a moment for extra vigilance about ones discipline. Always question every narrative, but especially optimistic narratives at this point in time. We are in relief rally territory. A large move up or down is coming before the end of the year.
Investors must demand a margin of safety in any new investments, and have contingency plans for volatility. Lastly before we take on an investment or a trade write down on paper with a pen and pencil exactly where one plans to exit the trade before you decide where to enter. Once you have a general exit area mapped out, then you wait for your entry signal, or build a position over a few days to a few weeks or a few weeks and a few months.
None of this is meant to sound alarmist, but rather realistic. Bubbles can inflate further (often beyond what skeptics think possible), but they do not last forever. Even if you believe this market will defy the odds, it costs little to prepare for the worst while hoping for the best. That might mean trimming exposure to speculative areas, bolstering your “sleep-at-night” funds, or simply bracing yourself psychologically for bumps ahead. Hope is not a strategy, as they say, but prudence is.
In the end, periods of extreme valuation often sow the seeds of future opportunity. IF A sharp correction occurs, it would actually restore healthier conditions for long-term investors. Lower prices are ultimately a good thing for those accumulating shares. Investors need to be in a position to survive and capitalize on accumulating shares at valuable prices for quality stocks. Just because a stock is dropping does not mean an investor should dollar cost average into it or DCA. I personally have taken my largest losses by doing exactly that in both swing trades and investments. I no longer break my rule. The stock needs to be making higher highs, while moving mostly sideways. By heeding the Buffett Indicator’s message now, investors will increase their odds of making it through a Black Swan event.
Reader Poll & Feedback!
We were unable to load this poll. Please refresh the page.
What do you think? Are we in a bubble that is about to burst? Do you think strong earnings and low rates actually justify a lot of these valuations in the market? I encourage investors and readers alike to share their thoughts in the comments, as a note, or restack this paragraph and tag me for a conversation starter. Lets start building healthy debates and diverse perspectives, making us all better investors in the end! As a reader or as an investor, you found this analysis helpful or thought provoking, consider subscribing to receive future updates on market insights and portfolio strategy. If you find my articles and analysis helpful consider becoming a paid supporter!
Join the conversation and feel free to share this post with fellow investors who are grappling with the same questions. Staying informed and engaged is one of the best investments investors can make in their financial future!
I Love all my readers and subscribers! You guys are awesome and are the reason I stay up until 4am Writing articles the day of Thanksgiving!
This content is for educational purposes only and is not financial advice. Trading futures involves substantial risk of loss and is not suitable for all investors. Most day traders lose money. Do your own research and consult a licensed financial professional before making any investment decisions.
Thanks for reading Intellectual Dissatisfaction! This post is public so feel free to share it.


")
")


Couldn't agree more. What if this market-to-GDP disconnect isn't just a bubble but a new, more volatile normal? This analsis is so good.