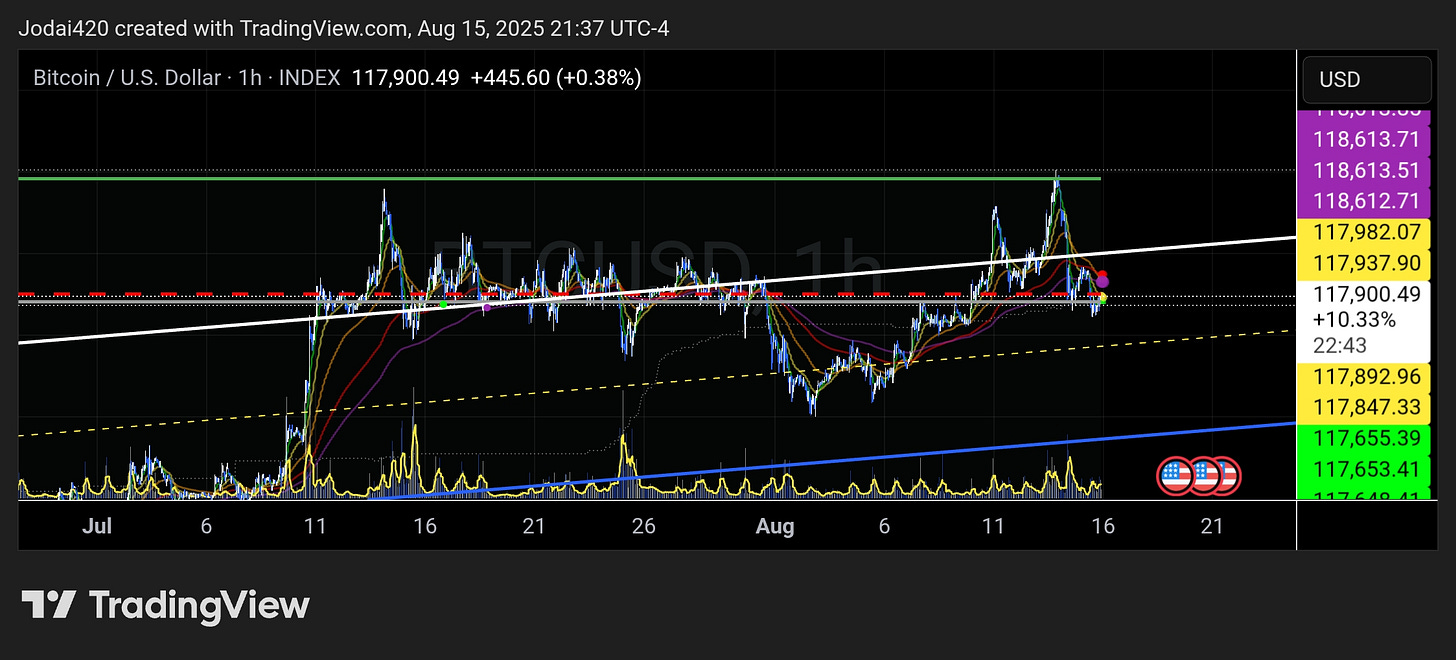
For a bullish outlook, Bitcoin (BTC) must remain above the red dashed horizontal line, which represents the Point of Control (POC) from the last quarter's Auto Anchored Volume Profile (AAVP). The AAVP, an indicator available on TradingView.com, is also referred to as Volume Profile (VP). Additionally, BTC needs to hold above the solid white horizontal line, marking the Value Area High (VAH) of the AAVP over the past year.
If the price reclaims the white slanted line—representing two standard deviations above the slanted yellow dashed regression trend line—the outlook for BTC becomes extremely bullish, with new all-time highs likely to follow quickly.
However, there is a critical caveat for this scenario: the move must be accompanied by substantial volume. This high volume would signify that a "smart money" institution or whale is using large market orders to absorb another major player's "iceberg" limit sell orders, which are likely placed to protect a large short position and prevent the price from rising above $124k.
Conversely, if BTC moves up without the high volume indicative of such an absorption, it is likely a bull trap and should be treated accordingly.
Potential Scenarios
If BTC falls below the POC and VAH, two primary scenarios are likely:
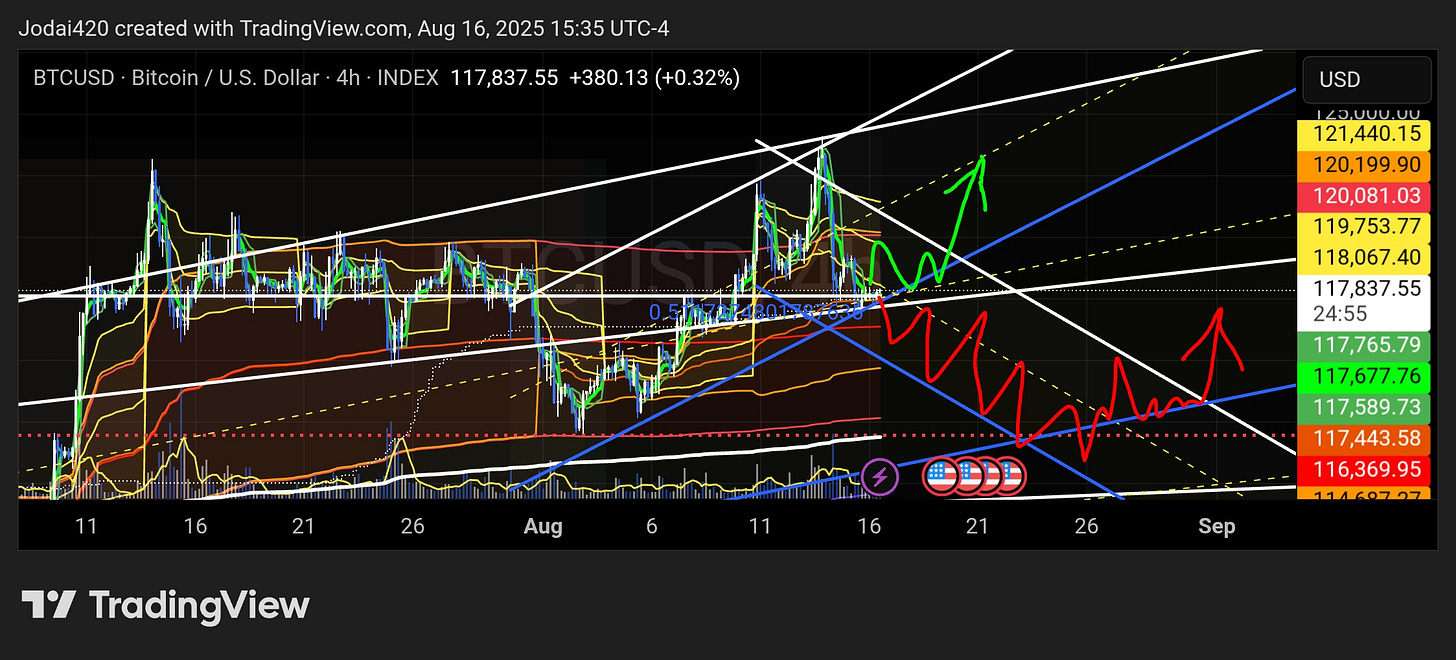
Use the first image in the article for most of the description of the analysis of BTC for both the Bullish and the Bearish scenario. The second image has had more channel work done in combination with the indicator auto anchored volume weighted average price(AAVWAP or simply VWAP for Volume Weighted Average Price,) to show a clearer representation of possible scenarios.
Bullish Scenario:
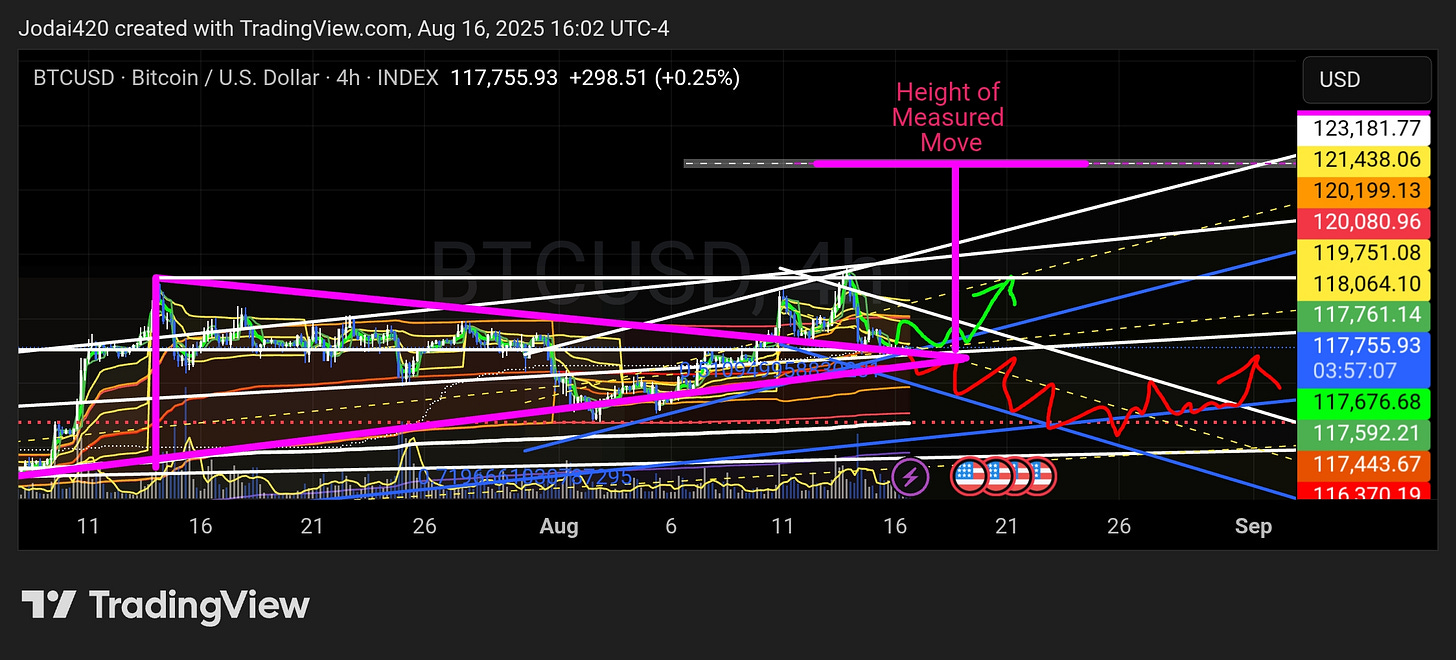
If BTC falls only one standard deviation through the quarterly point of control or yearly value Area High and then holds on the yellow dashed regression trend line could be the formation of another double bottom. This would be similar to a previous double bottom that established a cause (in this case, accumulation) sufficient to create the effect (a new uptrend) that pushed the price above the yearly VAH and quarterly POC. Such a formation would signal another sign of strength. The price is currently in a bull flag/pennant (the pink triangle).
If a new upward trend fails to achieve a measured move equal to the height of this flag, the breakout would be considered failed, and further downside would be expected. It's important to note, however, that the price has already broken out of the flag and is currently backtesting the quarterly POC and yearly VAH after making it halfway to the measured move target. The backtest of the flag typically starts the second leg up in a 2 impulse move up wwith a correction.
Bearish Scenario:
If BTC falls two standard deviations to the bottom of the lower regression trend channel (the blue slanted line, as indicated by the red bearish path), a period of range-bound trading is likely. Further downside should be expected if it appears a bearish whale is conducting an absorption campaign—using limit sell orders to absorb all market buy orders—around key levels like the all-time high, the quarterly POC, the yearly VAH, or the yellow regression trendline.
Concluding Thoughts
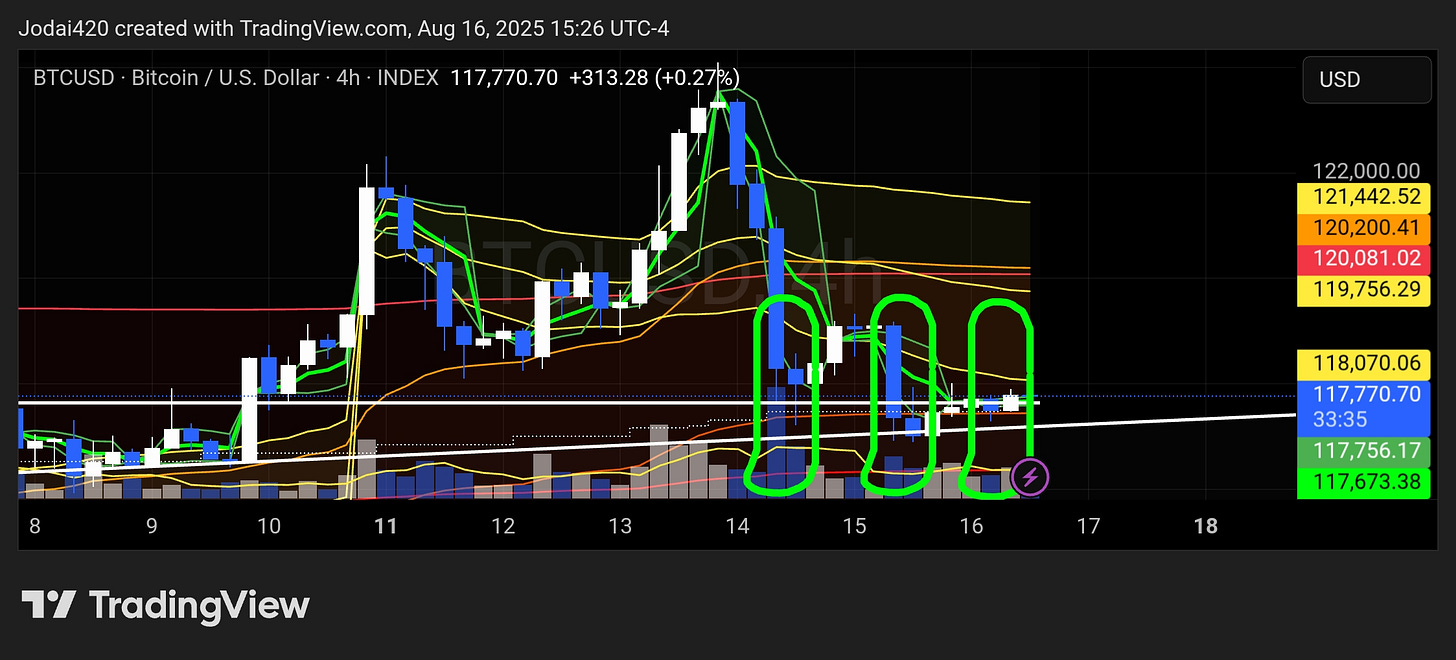
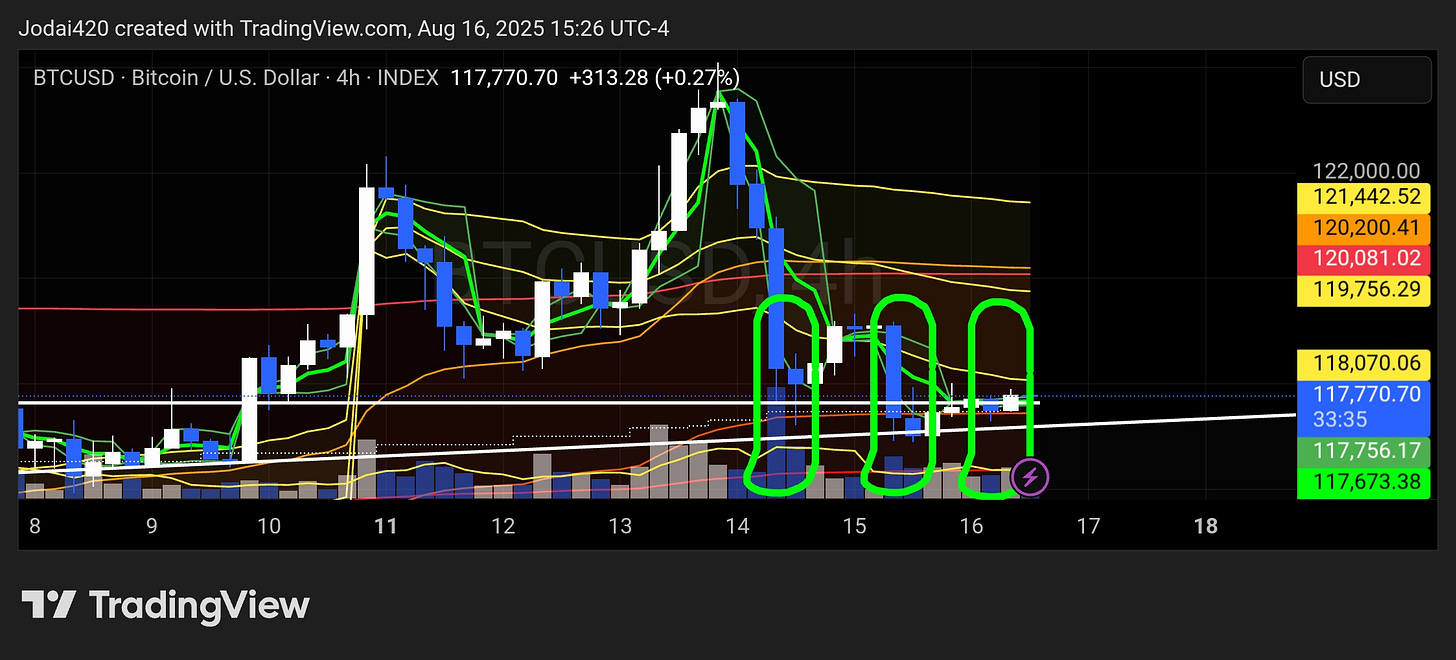
Until more price action unfolds, a bullish continuation or a bullish correction remain the most likely scenarios. This outlook is strengthened by the fact that every time BTC's price has dropped below the current quarterly POC and neared the regression trend line a large institution or whale has defended the price. The provided image highlights three bearish waves that attempted to push BTC lower, with each attempt being absorbed and the most recent one appearing particularly weak.
Historically, cryptocurrency and stock markets tend to rally into the end of the third and beginning of the fourth quarters. August and September are often months where markets go parabolic, followed by a sharp sell-off. Another rally and sell-off cycle typically occurs in October and November, leading into a "Christmas rally." Major sell-offs often happen in mid-to-late December as institutions, hedge funds, and mutual funds rebalance their portfolios and ETFs. Additionally, savvy investors often sell their losing assets at the end of the year to claim capital losses on their taxes, which can offset some of their gains.
Disclaimers:
This is not financial advice. Always speak to a certified money manager before making any financial decisions. This analysis represents the daily musings of an intraday trader.
Statement of Uncertainty:
(Fail-Safe Rule)
This analysis verifies that the provided text uses legitimate financial concepts, terminology, and theories correctly within the framework of technical analysis. However, the accuracy of the market predictions themselves cannot be established. All financial forecasting is inherently speculative and subject to significant uncertainty. The outcome of the described scenarios is not knowable in advance. upport my work, consider becoming a free or paid subscriber.


